Does HvPlot support Plotly for interactive dataframes?

I usually use Plotly and therefore would prefer to stick to that. But being new to HvPlot I run into obstacles when I try to plot with the setting: hvplot.extension(‘plotly’)

For instance when I try to do:

ifig = ipipeline.hvplot.hist(x=“Date”)

I get the error: AttributeError: ‘function’ object has no attribute ‘hist’
The hist function/method is described here: Plotting with Plotly — hvPlot 0.9.0 documentation

Could this be because HvPlot only supports Plotly for static data?
@hollowheights welcome to discourse!

Could you please supply a short executable piece of code
exhibiting your problem? It will be much easier to help you
when you do.

1 Like

Hi @ea42gh
I have updated my post now, hope that makes it clearer.

It’s possible I have overlooked something simple, but I am already many hours into trying to use Plotly for Hvplot and can’t even make these rather simple things work - so hoping for someone to clear up a few things for me.

UPDATE
It seems I was blocked from applying the changes. They were showing in my browser as, but only until updating the page.

Here is the updated post:

I usually use Plotly and therefore would prefer to stick to that. But being new to HvPlot I run into obstacles when I try to plot with the setting: hvplot.extension(‘plotly’)

For instance when I try to do:

from bokeh.sampledata.autompg import autompg_clean as df
import hvplot.pandas
import panel as pn
import holoviews as hv
hv.extension('plotly')
pn.extension('tabulator')
PALETTE = ["#ff6f69", "#ffcc5c", "#88d8b0", ]
# Make DataFrame Pipeline Interactive
idf = df.interactive()

# Define Panel widgets
cylinders = pn.widgets.IntSlider(name='Cylinders', start=4, end=8, step=1)
mfr = pn.widgets.ToggleGroup(
    name='MFR',
    options=['ford', 'chevrolet', 'honda', 'toyota', 'audi'], 
    value=['ford', 'chevrolet', 'honda', 'toyota', 'audi'],
    button_type='success')
yaxis = pn.widgets.RadioButtonGroup(
    name='Y axis', 
    options=['hp', 'weight'],
    button_type='success'
)

# Combine pipeline and widgets
ipipeline = (
    idf[
        (idf.cyl == cylinders) & 
        (idf.mfr.isin(mfr))
    ]
    .groupby(['origin', 'mpg'])[yaxis].mean()
    .to_frame()
    .reset_index()
    .sort_values(by='mpg')  
    .reset_index(drop=True)
)

Now if I simply try to use hvplot on the dataframe it works:

ihvplot = ipipeline.hvplot()

However, if I try to press tab after hvplot there is nothing suggested as methods to be called (as suggested in the documentation). Similarly, if I try to specify a plot type like this:

ihvplot = ipipeline.hvplot.hist(x=‘mpg’, y=yaxis, by=‘origin’,color=PALETTE)

or like this:
Preformatted textihvplot = idf.hvplot.hist()

I get the error: AttributeError: ‘function’ object has no attribute ‘hist’
The hist function/method is described here: Plotting with Plotly — hvPlot 0.9.0 documentation

Could this be because HvPlot only supports Plotly for static data?

Hi @hollowheights

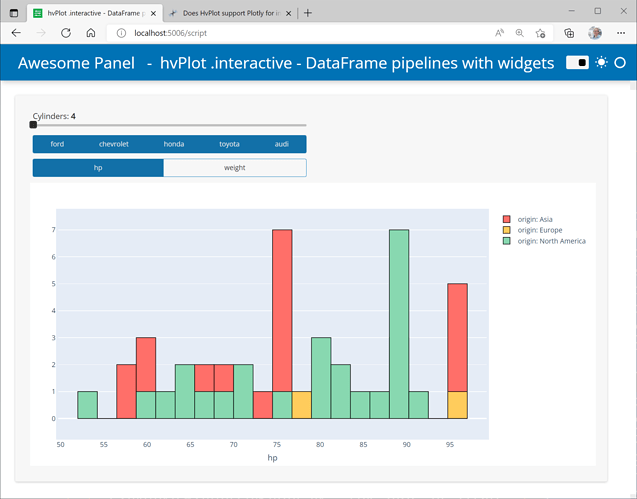
The issue is not plotly. The issue is that when the pipeline/ dataframe is interactive .hvplot is a function and has no methods. I.e. .scatter, .hist, … etc. is not defined.

What you can do is use .hvplot(....., kind="hist") instead of .hvplot.hist(...).

from bokeh.sampledata.autompg import autompg_clean as df
import hvplot.pandas
import panel as pn
import holoviews as hv
hv.extension('plotly')
pn.extension('tabulator')
PALETTE = ["#ff6f69", "#ffcc5c", "#88d8b0", ]

# Make DataFrame Pipeline Interactive
idf = df.interactive()

# Define Panel widgets
cylinders = pn.widgets.IntSlider(name='Cylinders', start=4, end=8, step=1)
mfr = pn.widgets.ToggleGroup(
    name='MFR',
    options=['ford', 'chevrolet', 'honda', 'toyota', 'audi'], 
    value=['ford', 'chevrolet', 'honda', 'toyota', 'audi'],
    button_type='success')
yaxis = pn.widgets.RadioButtonGroup(
    name='Y axis', 
    options=['hp', 'weight'],
    button_type='success'
)

# Combine pipeline and widgets
ipipeline = (
    idf[
        (idf.cyl == cylinders) & 
        (idf.mfr.isin(mfr))
    ]
    .groupby(['origin', 'mpg'])[yaxis].mean()
    .to_frame()
)
iplot = ipipeline.hvplot(x="mpg", y=yaxis, by='origin', color=PALETTE, kind="hist", width=1000, height=500)

import panel as pn
pn.extension(sizing_mode="stretch_width", template="fast")
pn.state.template.param.update(site="Awesome Panel", title="hvPlot .interactive - DataFrame pipelines with widgets")
pn.panel(iplot).servable()
1 Like

Note that we are working on fixing this: Add support for accessor in hvplot.interactive by Hoxbro · Pull Request #781 · holoviz/hvplot · GitHub

3 Likes