Now I am trying to make scatter and histogram refer to this html ( [Histogram — HoloViews v1.14.7] )
I want to spread this mix graph( scatter and histogram ) . So I insert this command [pn.extension(sizing_mode = ‘stretch_width’) ]
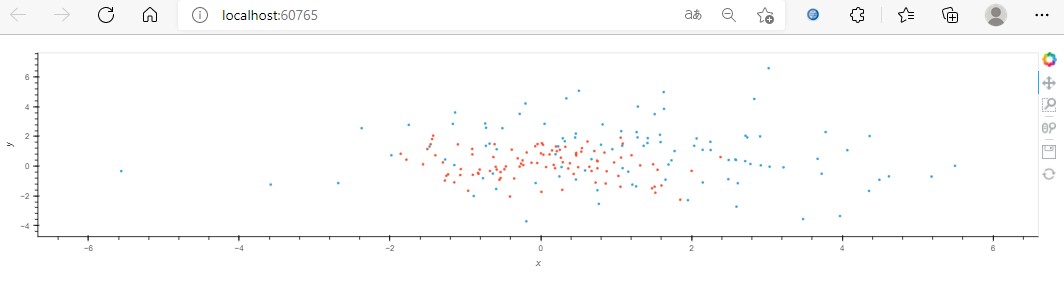
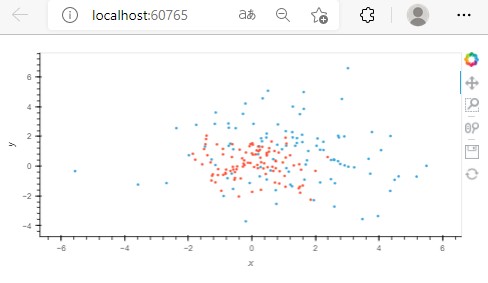
I can see spread my graph when use scatter only like as below.
screen shot 1 (spread scatter graph)
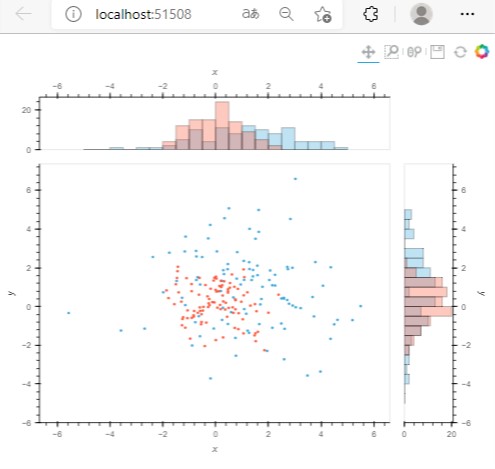
screen shot 2 (scale down scatter graph)
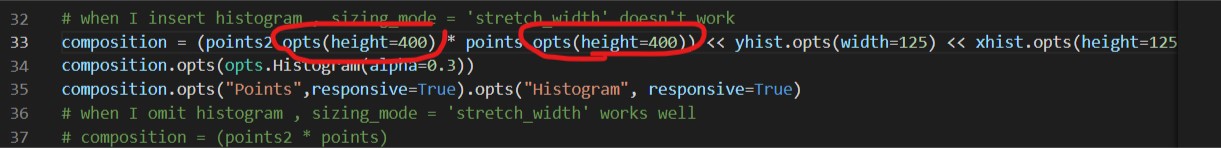
screen shot 3(code change point)
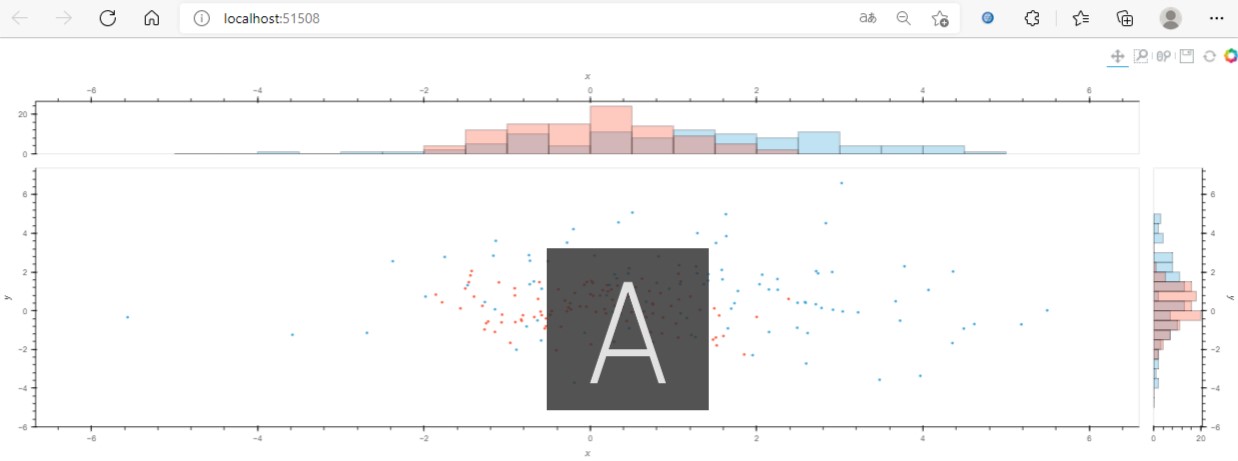
It works well. But I mixed histogram. It doesn’t work.
screen shot 4 (spread scatter and histogram graph : it doesn’t work well)

screen shot 5(code change point)
simple code
import panel as pn
import numpy as np
import holoviews as hv
from holoviews import opts
hv.extension('bokeh')
pn.extension(sizing_mode = 'stretch_width')
np.random.seed(1)
data = np.random.randn(10000)
frequencies, edges = np.histogram(data, 20)
print('Values: %s, Edges: %s' % (frequencies.shape[0], edges.shape[0]))
hv.Histogram((edges, frequencies))
xs = np.linspace(0, np.pi*2)
ys = np.sin(xs)
curve = hv.Curve((xs, ys))
curve + hv.Histogram(curve)
hv.Histogram(curve).opts(
opts.Histogram(fill_color=hv.dim('y').bin(bins=[-1, 0, 1], labels=['red', 'blue'])))
points = hv.Points(np.random.randn(100,2))
points.hist(dimension=['x','y'])
from holoviews.operation import histogram
points2 = hv.Points(np.random.randn(100,2)*2+1)
xhist, yhist = (histogram(points2, bin_range=(-5, 5), dimension=dim) *
histogram(points, bin_range=(-5, 5), dimension=dim)
for dim in 'xy')
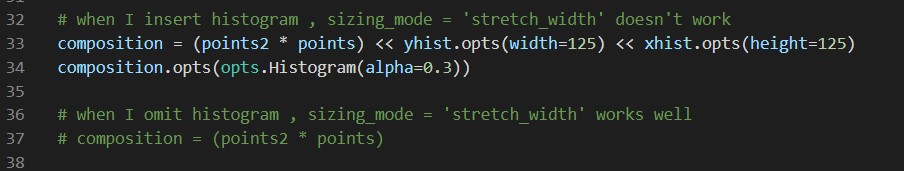
# when I insert histogram , sizing_mode = 'stretch_width' doesn't work
composition = (points2 * points) << yhist.opts(width=125) << xhist.opts(height=125)
composition.opts(opts.Histogram(alpha=0.3))
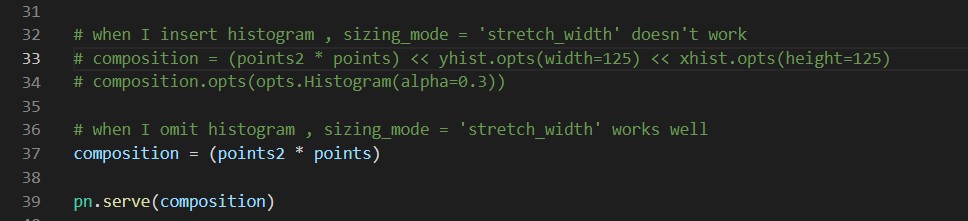
# when I omit histogram , sizing_mode = 'stretch_width' works well
# composition = (points2 * points)
pn.serve(composition)
I want to spread this graph to fit screen size. Could someone help me to teach this method?