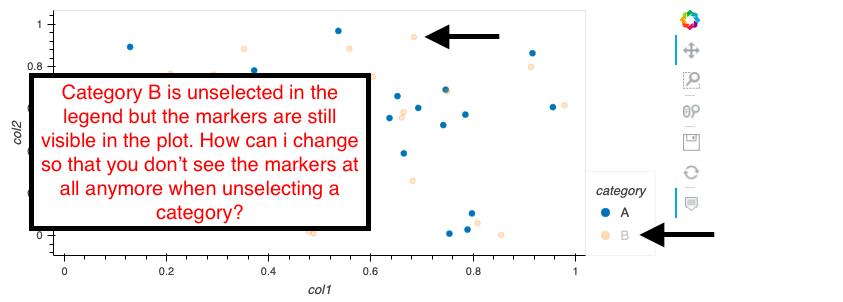
When I click on a category in a legend, the plot adjusts by only showing that category and its markers in the plot still slightly.
How can I change that so that when I click on a category, the markers of that category are not visible at all anymore in my plot?
Sample code:
import numpy as np
import pandas as pd
import holoviews as hv
hv.extension('bokeh')
import hvplot.pandas

# create sample data
df = pd.DataFrame({
    'col1': np.random.rand(50),
    'col2': np.random.rand(50),
    'category': np.random.choice(['A', 'B'], 50)
})

# plot line
df.hvplot.scatter(x='col1', y='col2', by='category')
df.hvplot.scatter(x='col1', y='col2', by='category', muted_alpha=0)
Thanks so much! I am always surprised how much there is still to learn (and how easy the answer sometimes can be
So the solution is using option: muted_alpha=0
mcav
September 11, 2020, 1:27pm
4
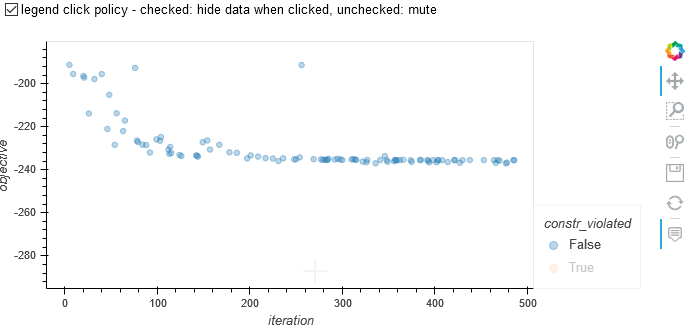
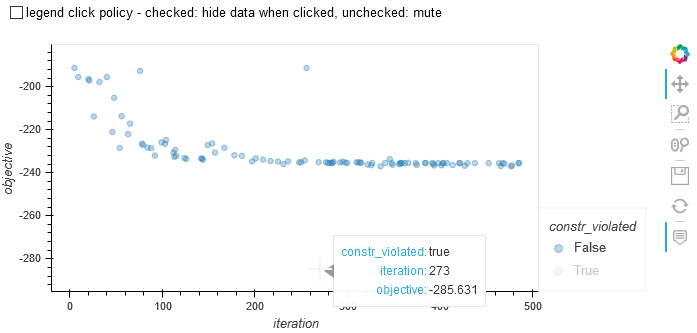
Setting the muted_alpha=0 still only mutes the data. What you really want is to hide the data. Hide also works for hover, while mute doesn’t (see below). In Bokeh this is possible by setting p.legend.click_policy=‘hide’. In Holoviews I didn’t find an option for this.
p=hv.render(df.hvplot.scatter(x='col1', y='col2', by='category'), backend='bokeh')
p.legend.click_policy='hide'
Would be nice if this was supported in Holoviews.
See figure for my data.
compare
hide (left) with
mute (right)
1 Like
Hoxbro
April 12, 2021, 4:02pm
5
For future references, it can be done like this in newer version of hvplot.
df.hvplot.scatter(x='col1', y='col2', by='category').opts(legend_opts={"click_policy": "hide"})
3 Likes
 )
)