Hi,
I am using Datashader and Bokeh to render a series of lines.
These are organised by row with the key columns being [x1, y1, x2, y2]
Is it possible to pass these to holoviews for interactive plotting?
I have managed to get it working by preprocessing to have in the HvCurve format where each entry is
[x1, y1]
[x2, y2]
[nan, nan]
But this is less efficient in terms of memory usage and requires pre-processing which impacts filtering.
If I try
agg = HvCurve(ddf2, ('x1', 'x2'), ('y1', 'y2'))
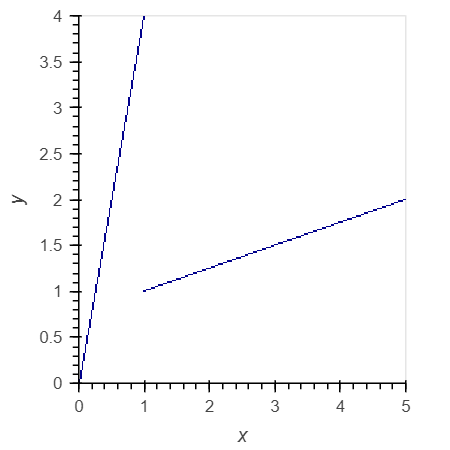
Then I get a lot of spurious extra lines.
Essentially, I can render images using:
from datashader.utils import export_image

cvs = ds.Canvas(plot_width=  4*800,
                plot_height= 4*600,
               )

imbuf = cvs.line(ddf2,
                 x=('x1', 'x2'),
                 y=('y1', 'y2'),
                 axis=1,
                 agg=ds.count('population'),
                 antialias=True
                )

np = tf.spread(tf.shade(imbuf, cmap=cc.fire), px=1)

filename = "plot.png"
export_image(np, filename, background="black")
can I do similar using Holoviews, with one row describing both points of the line?
