I am trying to understand how to use dynamic selection expressions for holoviews plots. I know that .select takes a parameter called selection_expr. This works fine with a static dim expression. But I can’t get it to work with a dynamic dim expression with a slider. I know that I have to change .select to .apply.select, but even then it doesn’t work. It gets stuck at the first value that it sees from the slider.
Here is a self contained, minimal code example:
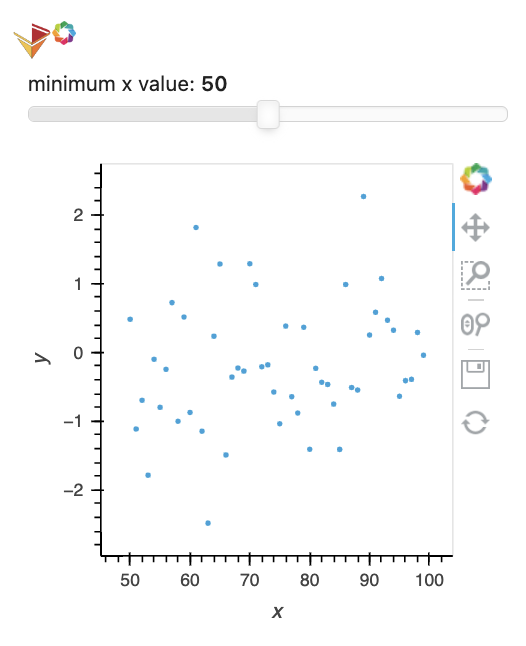
# this code generates a scatter plot and a slider
# so that only points > slider value will appear

import numpy as np
import holoviews as hv
from holoviews import dim
import panel as pn

hv.extension('bokeh')


threshold = pn.widgets.IntSlider(start=10, end=90, value=50,
                                 name='minimum x value')

scatter = hv.Scatter((np.arange(100), np.random.randn(100)),
                     kdims=['x'], vdims=['y'])

sel = (dim('x') >= threshold)

pn.Column(threshold, scatter.apply.select(selection_expr=sel))
Does this maybe need to be a dynamic map thing, there’s a similar idea here in the manual that is applying outlier type stuff dynamically Data Processing Pipelines — HoloViews v1.15.0
I was trying to find some documentation or examples supporting your assumption to figure out how to get it working. But I was not able to find any useful documentation for apply.select.
Unfortunately that example does not work. It gives an error message if the outlier parameter is not given explicitly using selection_expr=outlier to .select.apply()
Otherwise I wasn’t able to find an example in the official documentation. Just generally I wished the documentation would be a bit better. Going through the API, there seems to be a lot of (relatively abstract) functionality that is not really described or used anywhere. I think even if just the API had more text, that would already help a lot.
I really like holoviews and hvplot a lot, especially in combination with Bokeh. I just wished that sometimes the documentation would be clearer or more examples given.
Like I remember this one feature where you can add numbers on top of your heatmap plot, and it’s using this trick with hv.Labels(heatmap). Or that you can add a linear fit to a scatter plot with hv.Slope.from_scatter(scatter). Or that you get markers on your line plots by overlaying a scatter plot. Stuff like this is nifty, but not very intuitive. I get the feeling that there might be more “tricks” like this, but not described in the documentation.
Actually that link that I shared is an article from Philipp Rudiger who works on the project. So I am somewhat surprised that it’s not working. Maybe the API has changed.
Another thing: I think your workaround isn’t exactly the same. The .apply methods are supposed to also take NdLayouts, Holomaps and DynamicMaps as input and apply the function to every element individually. Maybe using
Hi @Jan, it looks like a bug. The code below shows that apply.sample, apply.transform, apply.opts all lead to a live link between the widget and the output. But for apply.select, the live link seems broken(but the link is not broken since as soon as the display is refreshed through the use of the other widgets, we can see that the value of the threshold widget is correctly taken into account).