Dynamic Map over a datashade

Hello,

Im using holoviews in a Bokeh serve to plot a big database, the thing is that the user can filter or even change the database for different variables and plot according to that filter. I’ve done this via DynamicMap

Example code:

    import holoviews as hv
    ...

    renderer = hv.renderer('bokeh').instance(mode='server')
    hv.extension('bokeh')

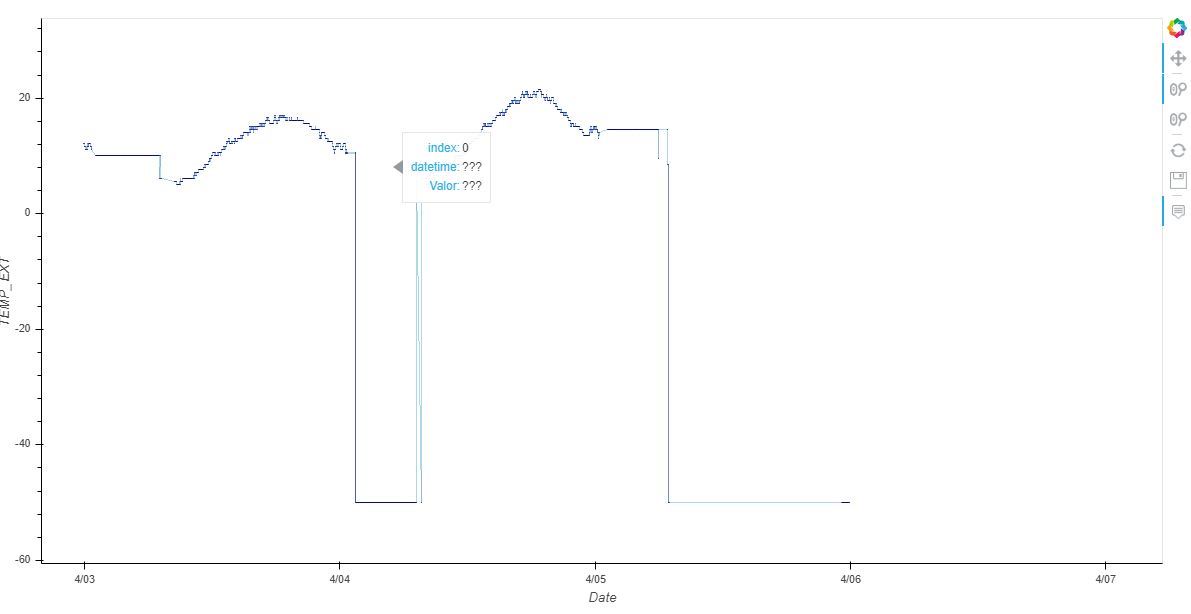
    hover = HoverTool(tooltips=[('index', '$index'), ('datetime', '@Date{%Y-%m-%d:%H:%M:%S}'), 
               ('Valor', '@Value{0.00}')],
               formatters={'@Date': 'datetime'},
               mode='mouse')
    pipe = Pipe(data=np.array([[], [], 'Var']))
    dmap = hv.DynamicMap(timeseries, streams=[pipe])
    hvplot = renderer.get_plot(dmap, curdoc())
    ....
    def timeseries(data):

          return hv.Curve(dict(Date=data[0], Value=data[1]), 'Date', (('Value', data[2]))).opts(width=1200, 
                   height=600, tools=['xwheel_zoom', 'pan'], active_tools=['xwheel_zoom', 'pan'], 
                    default_tools= ['reset', 'save', hover])

This works perfectly as expected when pipe.send(…) the curve changes as expected (also whit hv.scatter). The problem is that the interactivity is reduced when a lot of points are plotted over 1 million. So what I am wanting to do is change the following (returning a datashade):

    def timeseries(data):

          return datashade(hv.Curve(dict(Date=data[0], Value=data[1]), 'Date', (('Value', 
                     data[2]))).opts(width=1200, height=600, tools=['xwheel_zoom', 'pan'], active_tools= 
                     ['xwheel_zoom', 'pan'], default_tools= ['reset', 'save', hover]))

But I get the following error:

Exception: Nesting a DynamicMap inside a DynamicMap is not supported. Ensure that the DynamicMap callback returns an Element or (Nd)Overlay. If you have applied an operation ensure it is not dynamic by setting dynamic=False.

I would like a workaround or alternative to this, HoloMap i think wouldnt work because the user can change and filter the whole database whit continuous values.

Setting dynamic to False is not a solution as user can zoom in the data

Thank You in advice.

Josu Catalina

It’s pretty simple, datashade should be applied to the DynamicMap not inside the DynamicMap. Basically you should generally try to minimize the computation in a single callback and instead chain operations either by using an actual HoloViews Operation or by using .apply. In this case you construct your DynamicMap and then simply call datashade on it:

def timeseries(data):
    return hv.Curve(dict(Date=data[0], Value=data[1]), 'Date', (('Value', data[2])))

dmap = hv.DynamicMap(timeseries, streams=[pipe])
datashade(dmap).opts(
    width=1200,  height=600, tools=['xwheel_zoom', 'pan'],
    active_tools=['xwheel_zoom', 'pan'], default_tools= ['reset', 'save', hover]
)

For more background I’d recommend reading the Transforming Elements and Data Pipelines user guides.

1 Like

Thank You that solved the problem and now is much more interactive! also thanks for the fast response!.

But i am facing two different problems now sorry… I think thats because I started all this project only with bokeh library.

1.The Custom HoverTool seems not working not showing any data (worked without datashader on top)


In the other side when I add the default ‘hover’ (tools=['hover]) to the tools I actually see the values but the Date appears as a number. I dont know how to apply formatters to the default hover tool or how to make the custom hover work in top of datashader object.

  1. Previously i adjust the range in this way:
        hvplot.state.y_range.start = min_plt - 2
        hvplot.state.y_range.end = max_plt + 2
        hvplot.state.y_range.bounds = (min_plt - 20, max_plt + 20)

The same using DateTime for x axis.

This worked fine without datashader, before when only getting hv.Curve from DynamicMap but now error messages appear. Should I use redim over datahsade object??

  1. This migth be a bug but if I use first the ywheel_zoom tool before the other xwheel_zoom or wheel_zoom tools an error occurs. I will try to ilustrate it with some

.gif

future: <Future finished exception=UFuncTypeError(<ufunc 'true_divide'>, (dtype('<M8[ns]'), dtype('float64')))>
Traceback (most recent call last):
  File "c:\users\catal\appdata\local\programs\python\python36\lib\site-packages\tornado\gen.py", line 191, in wrapper
    result = func(*args, **kwargs)
  File "c:\users\catal\appdata\local\programs\python\python36\lib\site-packages\holoviews\plotting\bokeh\callbacks.py", line 418, in process_on_change
    self.on_msg(msg)
  File "c:\users\catal\appdata\local\programs\python\python36\lib\site-packages\holoviews\plotting\bokeh\callbacks.py", line 141, in on_msg
    processed_msg = self._process_msg(filtered_msg)
  File "c:\users\catal\appdata\local\programs\python\python36\lib\site-packages\holoviews\plotting\bokeh\callbacks.py", line 815, in _process_msg
    x0 = convert_timestamp(x0)
  File "c:\users\catal\appdata\local\programs\python\python36\lib\site-packages\holoviews\plotting\bokeh\util.py", line 98, in convert_timestamp
    datetime = dt.datetime.utcfromtimestamp(timestamp/1000.)
numpy.core._exceptions.UFuncTypeError: ufunc 'true_divide' cannot use operands with types dtype('<M8[ns]') and dtype('float64')

But if I restart the server and use the xwheel_zoom first works perfectly:

Sorry for bothering that much.

Josu Catalina

Any solution @philippjfr ?

datashade returns an image which loses some of the information.

Right, you will want to use rasterize not datashade.

Okay thanks and the 3rd problem I think its a bug or something.

Right, probably an error. Don’t think we anticipated usage of the {x/y}wheel_zoom tools. An issue would be appreciated.

Issue appointed in GitHub

Also which could be the alternative to programatically fix the range of plots like it would be in bokeh

        hvplot.state.y_range.start = min_plt - 2
        hvplot.state.y_range.end = max_plt + 2
        hvplot.state.y_range.bounds = (min_plt - 20, max_plt + 20)

This does not work

Thank You.

Josu Catalina.