mycarta
September 23, 2021, 5:21pm
1
I have a DataFrame with a lot of columns.
Here’s how I do it. I first define the plotting function:
def plot3d(column='Moment Magnitude'):
    dataset3d = hv.Dataset((df['Easting (m)'], df['Northing (m)'], df['Depth (m)'], df[column]),['x', 'y', 'z'], 'value')
    sc = hv.Scatter3D(dataset3d).opts(opts.Scatter3D(azimuth=60, elevation=20, s=50,
                                                     color = 'value', cmap = 'inferno', fig_size=300))
    return sc
then the app:
column  = pn.widgets.Select( value='Moment Magnitude', options=list(df.columns))
reactive_plot = pn.bind(plot3d, column)
widgets = pn.Column("Select data column", column)
app = pn.Row(reactive_plot, widgets)
pn.serve(app)
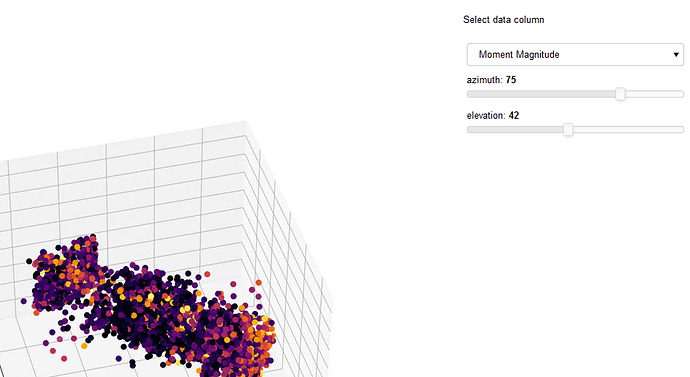
My question is, with this approach, what would be the easiest way to add sliders for controlling dynamically the azimuth and elevation parameters and allow rotating the plot?
1 Like
FelixPM
September 24, 2021, 2:16am
2
Hello
def plot3d(column, az, elev):
    dataset3d = hv.Dataset((df['Easting (m)'], df['Northing (m)'], df['Depth (m)'], df[column]),['x', 'y', 'z'], 'value')
    sc = hv.Scatter3D(dataset3d).opts(opts.Scatter3D(azimuth=az, elevation=elev, s=50,
                                                     color = 'value', cmap = 'inferno', fig_size=300))
    return sc

column  = pn.widgets.Select( value='Moment Magnitude', options=list(df.columns))
azlider = pn.widgets.IntSlider(value=60, start=-180, end=180)
elevaider = pn.widgets.IntSlider(value=20, start=0, end=90)
widgets = pn.Column("Select data column", column, azlider, elevaider)
reactive_plot = pn.bind(plot3d, column, azlider, elevaider)
app = pn.Row(reactive_plot, widgets)
pn.serve(app)
This is following the reactive function API which you can read about here and look at the other ways of using Panel APIs, as each has pros and cons.
Cheers
3 Likes
mycarta
September 24, 2021, 2:05pm
3
It worked like a charm, thank you!
The only thing I changed was to add names to the sliders:
azlider = pn.widgets.IntSlider(name='azimuth', value=60, start=-180, end=180)
elevaider = pn.widgets.IntSlider(name='elevation', value=20, start=0, end=90)
1 Like
