I’d like to load in a spatial grid as an xarray object, plot the grid, and modify its values interactively. I know this can be done with xarray using select features, but can it be done interactively? Specifically, can this be done with hvPlot or another package of the holoviz family?
import xarray as xr #version 0.15.1
import hvplot.xarray #version 0.6.0
import geoviews as gv #version 1.8.1
gv.extension('bokeh')
# read in downloaded dataset - https://github.com/jsimkins2/esm_lab/blob/main/landmaskTools/ocean_mask.nc
ds = xr.open_dataset("/Users/james/Downloads/ocean_mask.nc")
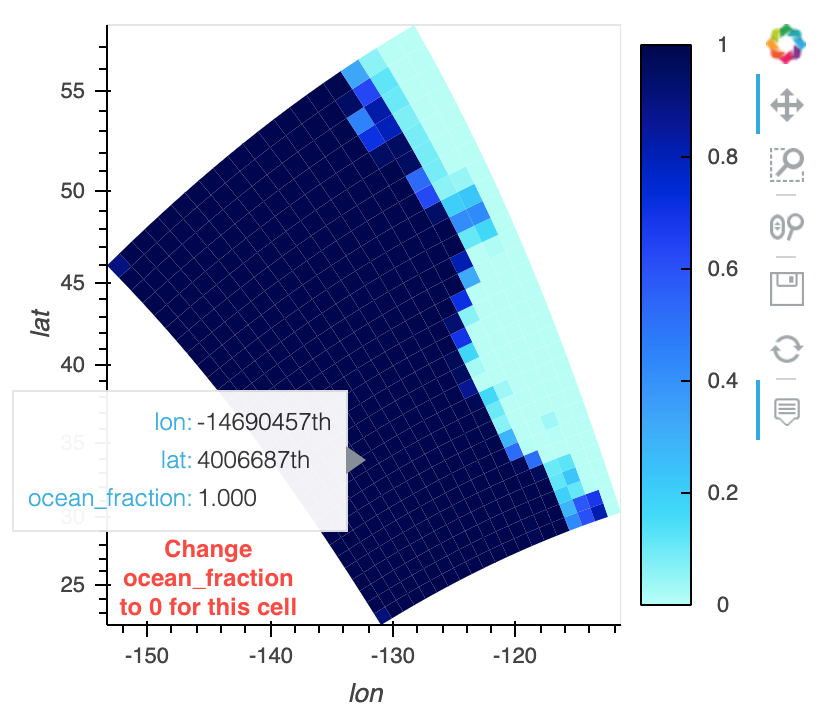
ds.ocean_fraction.hvplot.quadmesh(x='lon', y='lat',project=True,geo=True, dynamic=True)
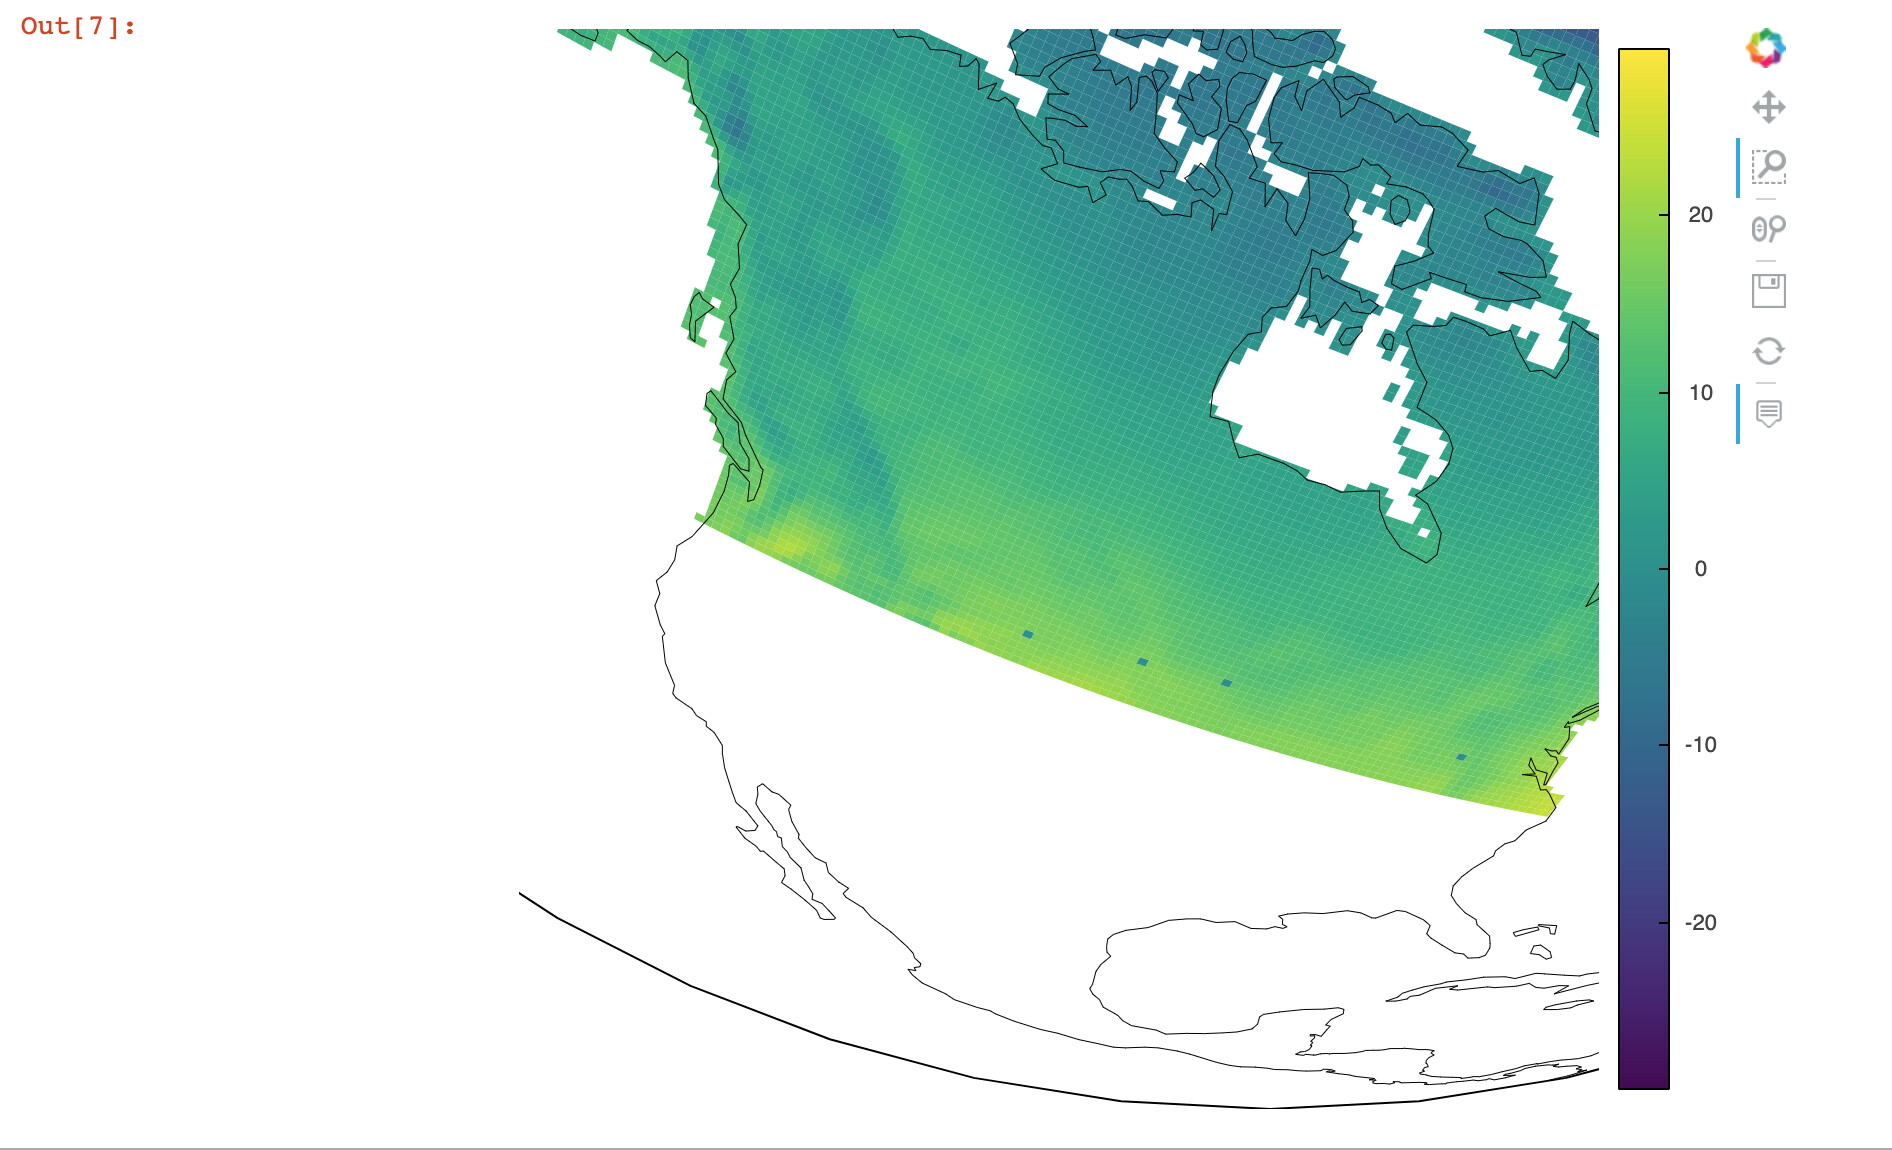
Thanks so much @ahuang11 ! Is there a way to get this to work with curvilinear grids? For example, when I try to use the rasm tutorial dataset, clicking removes the entire plot.
import xarray as xr #version 0.15.1
import hvplot.xarray #version 0.6.0
import holoviews as hv
import geoviews as gv #version 1.8.1
gv.extension('bokeh')
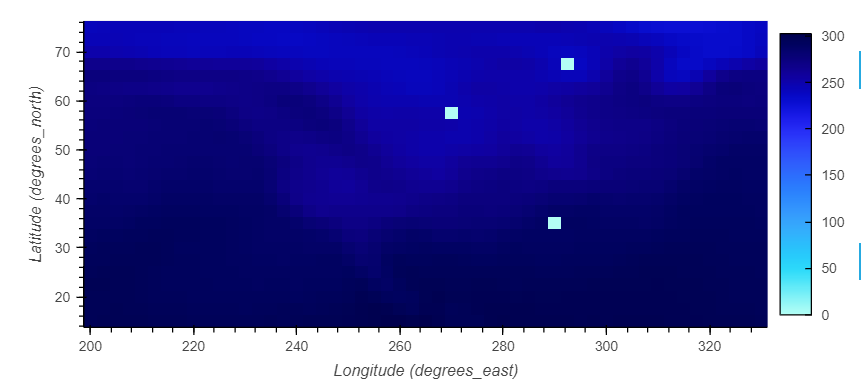
ds = xr.tutorial.open_dataset('rasm').isel(time=0)
da = ds["Tair"]
def plot(x, y):
if x is not None:
da_sel = da.sel(lon=x, lat=y, method="nearest")
da.loc[dict(lat=da_sel["lat"].item(), lon=da_sel["lon"].item())] = 0
return da.hvplot.quadmesh(x='xc', y='yc', geo=True, project=True)
tap_stream = hv.streams.Tap()
dmap = gv.DynamicMap(plot, streams=[tap_stream])
dmap