Hello, I wasn’t sure if this behavior would be considered a bug or user-error. When I set up a dataframe with one column as an object dtype and the other columns as float or int, letting the user switch between columns in a DynamicMap results in a y axis which is “frozen” in the type (categorical/linear) that it was first created. Depending on the plotting extension used, the behavior ranges from an exception to just undesirable.
Holoviews version 1.15.0
For reference, here are what I expect categorical and floating point scatter plots to look like in both the bokeh and matplotlib backends:
Bokeh:

Matplotlib:
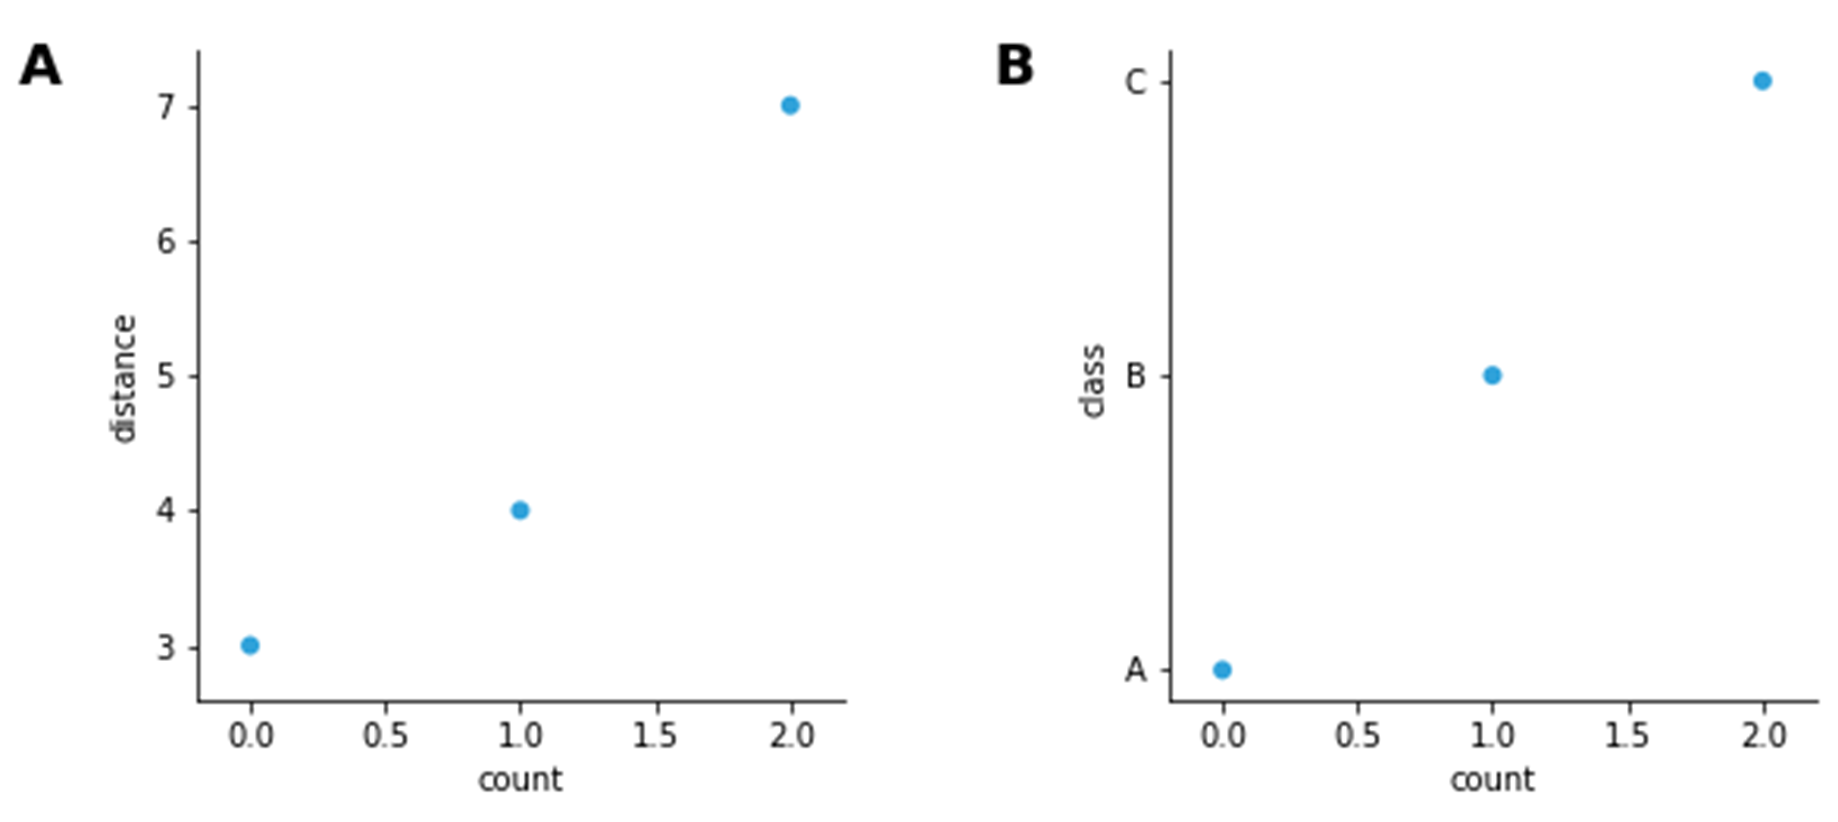
Here is the code used to produce those charts (with the appropriate backend uncommented).
import holoviews as hv
#hv.extension('matplotlib')
hv.extension('bokeh')
import pandas as pd

# creating a dataframe with both an int and an obj dtype
df = pd.DataFrame({
    'count':    [ 0,    1,    2 ],
    'distance': [ 3,    4,    7 ],
    'class':    ['A',  'B',  'C']
})
hv.Scatter(df, kdims='count', vdims='distance') +\
    hv.Scatter(df, kdims='count', vdims='class')
Now if I change the code a little to make it a DynamicMap, I can break the bokeh backend completely by setting the default to the “distance” column and then changing the drop-down box to “class”:
import holoviews as hv
#hv.extension('matplotlib')
hv.extension('bokeh')
import pandas as pd

# creating a dataframe with both an int and an obj dtype
df = pd.DataFrame({
    'count':    [ 0,    1,    2 ],
    'distance': [ 3,    4,    7 ],
    'class':    ['A',  'B',  'C']
})

# set up a DynamicMap where the user can select the y_axis column
y_dim = hv.Dimension('y_column', values=df.columns.tolist(), default='distance')
def return_scatter(col_name):
    return hv.Scatter(df, kdims='count', vdims=[col_name])
hv.DynamicMap(return_scatter, kdims=y_dim).opts(framewise=True, axiswise=True)
This code run directly results in an exception:
ValueError: failed to validate Range1d(id='1643', ...).start: expected an element of either Float, Datetime or TimeDelta, got 'A'
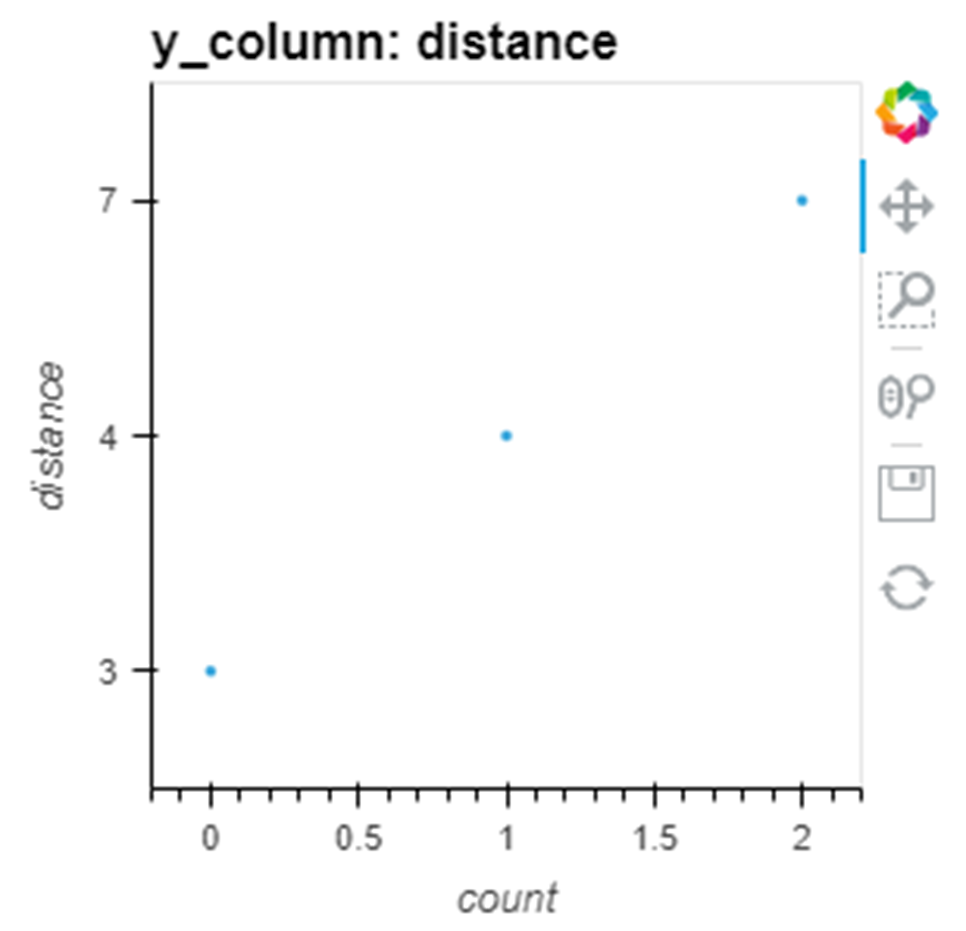
If I change the define of ‘y_dim’ such that default=‘class’, there is no longer an exception, but the y axis is frozen as a categorical type. Note the 7 data point being plotted in the wrong place spatially:
The matplotlib backend behaves a little bit differently. If I comment out bokeh, uncomment matplotlib and go back to my first case where the default=‘distance’ I get a blank plot with the y axis unchanged:
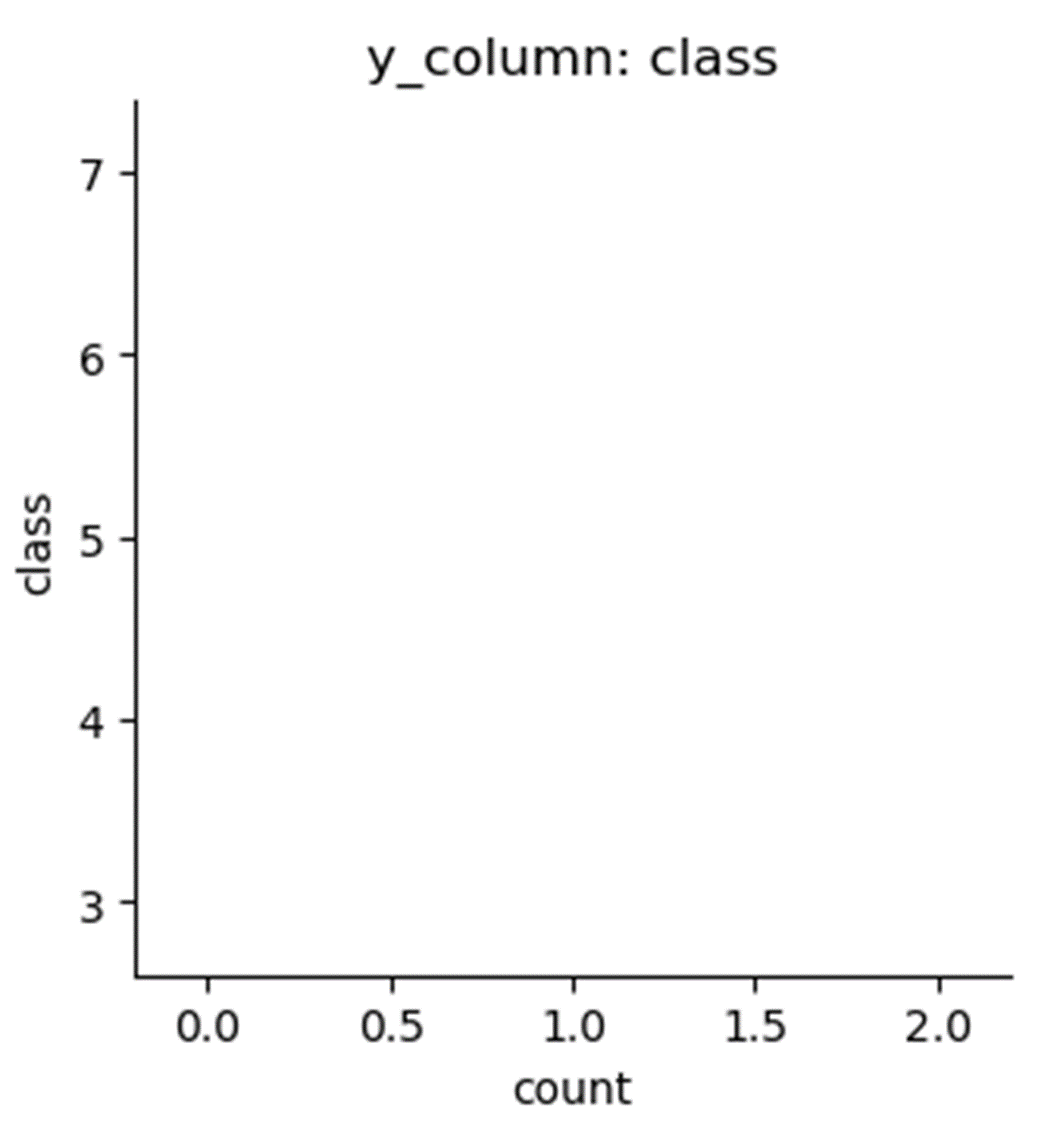
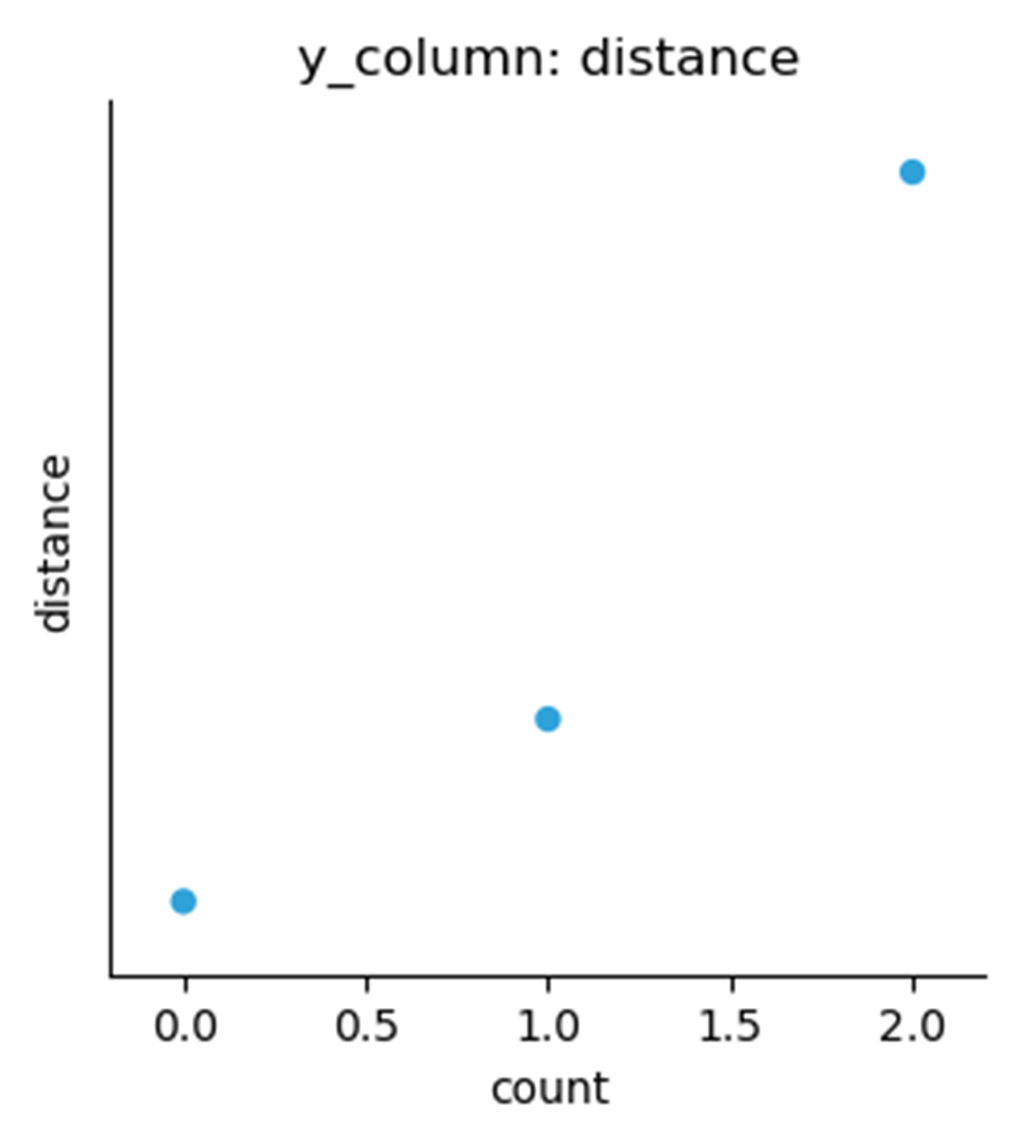
When I change default=‘class’ I get a normal plot, but the axis ticks and tick labels are never drawn:
Additionally, the behavior degrades as I toggle the drop-down back and forth between ‘class’ and ‘distance’, ultimately resulting in a blank “class” graph, identical to the figure “y_column:class”, 2 above.
So my questions:
- Should I enter this as a bug?
- Is there a workaround? Maybe some way to force the axis type to change?
- Am I going about this in a bonkers way? Should I be using a different mechanism to let the user switch between graphs of different dtypes?
Thanks!