Hello 
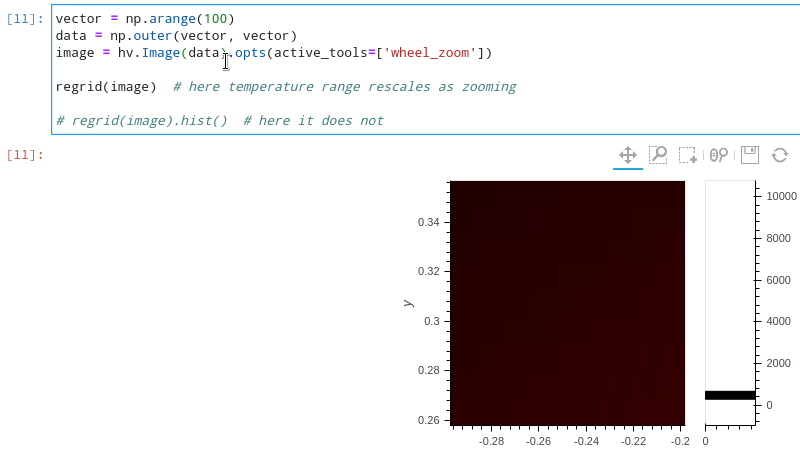
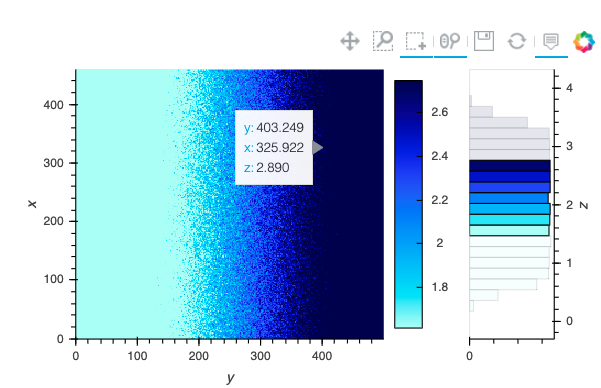
I would like to have a dynamic map of image that I would like to zoom in in such way that when I zoom in some region that looks to be a single color region, the color scale adapts to that region. I was able to achieve this by using regrid, but the problem is that I additionally need a histogram which seems to prevent the color scale from adapting. Please see the code below and animation.
import numpy as np
import holoviews as hv
from holoviews.operation.datashader import regrid
hv.extension('bokeh')

vector = np.arange(100)
data = np.outer(vector, vector)
image = hv.Image(data).opts(active_tools=['wheel_zoom'])

regrid(image)  # here temperature range rescales as zooming
# regrid(image).hist()  # here it does not :(
Is there a way to achieve adapting color scale and a histogram at the same time?
Thank you for your time.
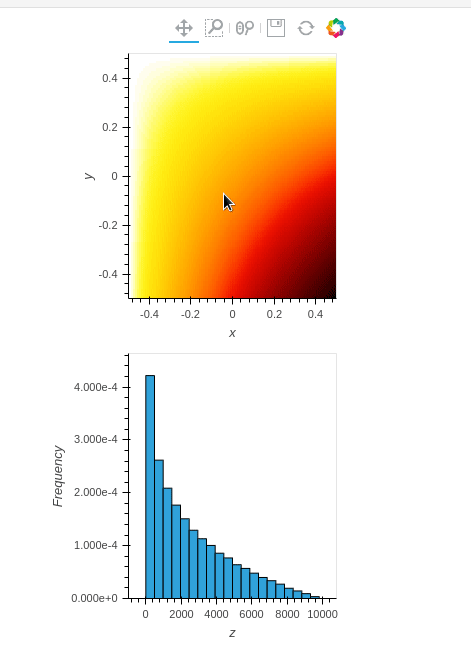
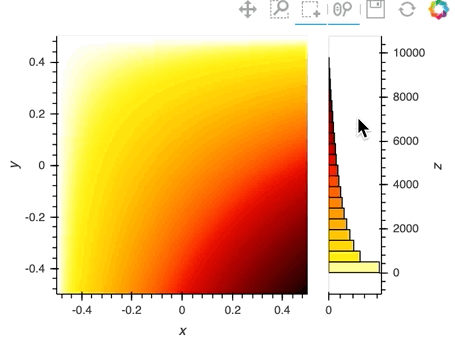
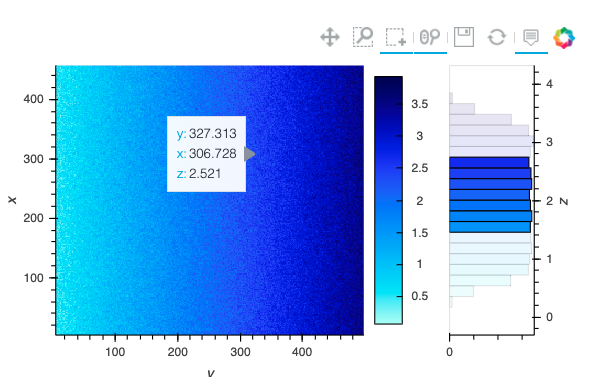
So the reason why this happens is because the color scale between the histogram and the image are linked and restoring this behavior was actually fixing an earlier regression. We should make that toggleable, but the nice thing about that is that you can do this:
If you want to be able to toggle that behavior off an issue would be appreciated.
Thank you for the answer.
I believe it might be useful, e.g. in case when there is no need for selecting bins just moving the histogram out of adjoin layout like below, when the cmap is no longer preserved:
regridded = regrid(image)
hist = regridded.hist(adjoin=False)
(regridded + hist).cols(1)
I’ll create an issue tonight
I am using version 1.13.5, and finding that the behavior is a bit off when using rasterize = True or regrid.
This is what happens:
Calling hvplot with .hist creates a plot and a histogram.
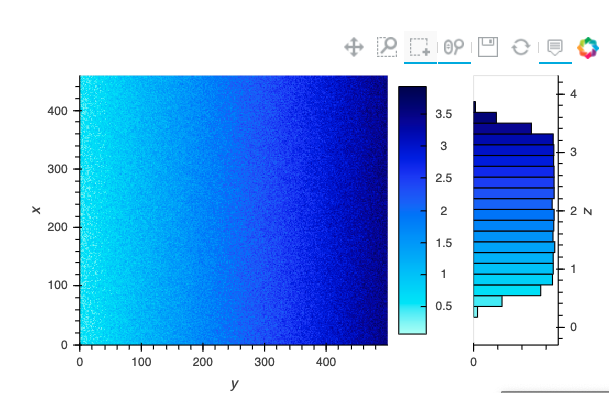
I can select on the histogram to get a new color range.
But, as soon as I move or zoom into the plot after this the color range goes back to the original, even though the histogram plot shows that some part has been selected.
Maybe this is not inconsistent from what you are showing above, but seems a bit odd. Is there a way to keep the color range from not changing during zoom or pan. The user might select a color range, and then zoom or pan a bit to play with the data and suddenly you are back to the color range of the full data. In particular because the color ranges are set only qualitatively using the hist, it is even more problematic - since it makes it impossible to compare different regions of the data precisely.
Is this a datashader related thing? Because the behavior is like what I would expect if I am not using regrid or rasterize.
Maybe you could point me to the documentation that explains how the hist feature works.