Just wondering if there’s a guide that shows how to use DynamicMaps with custom Panel layouts?
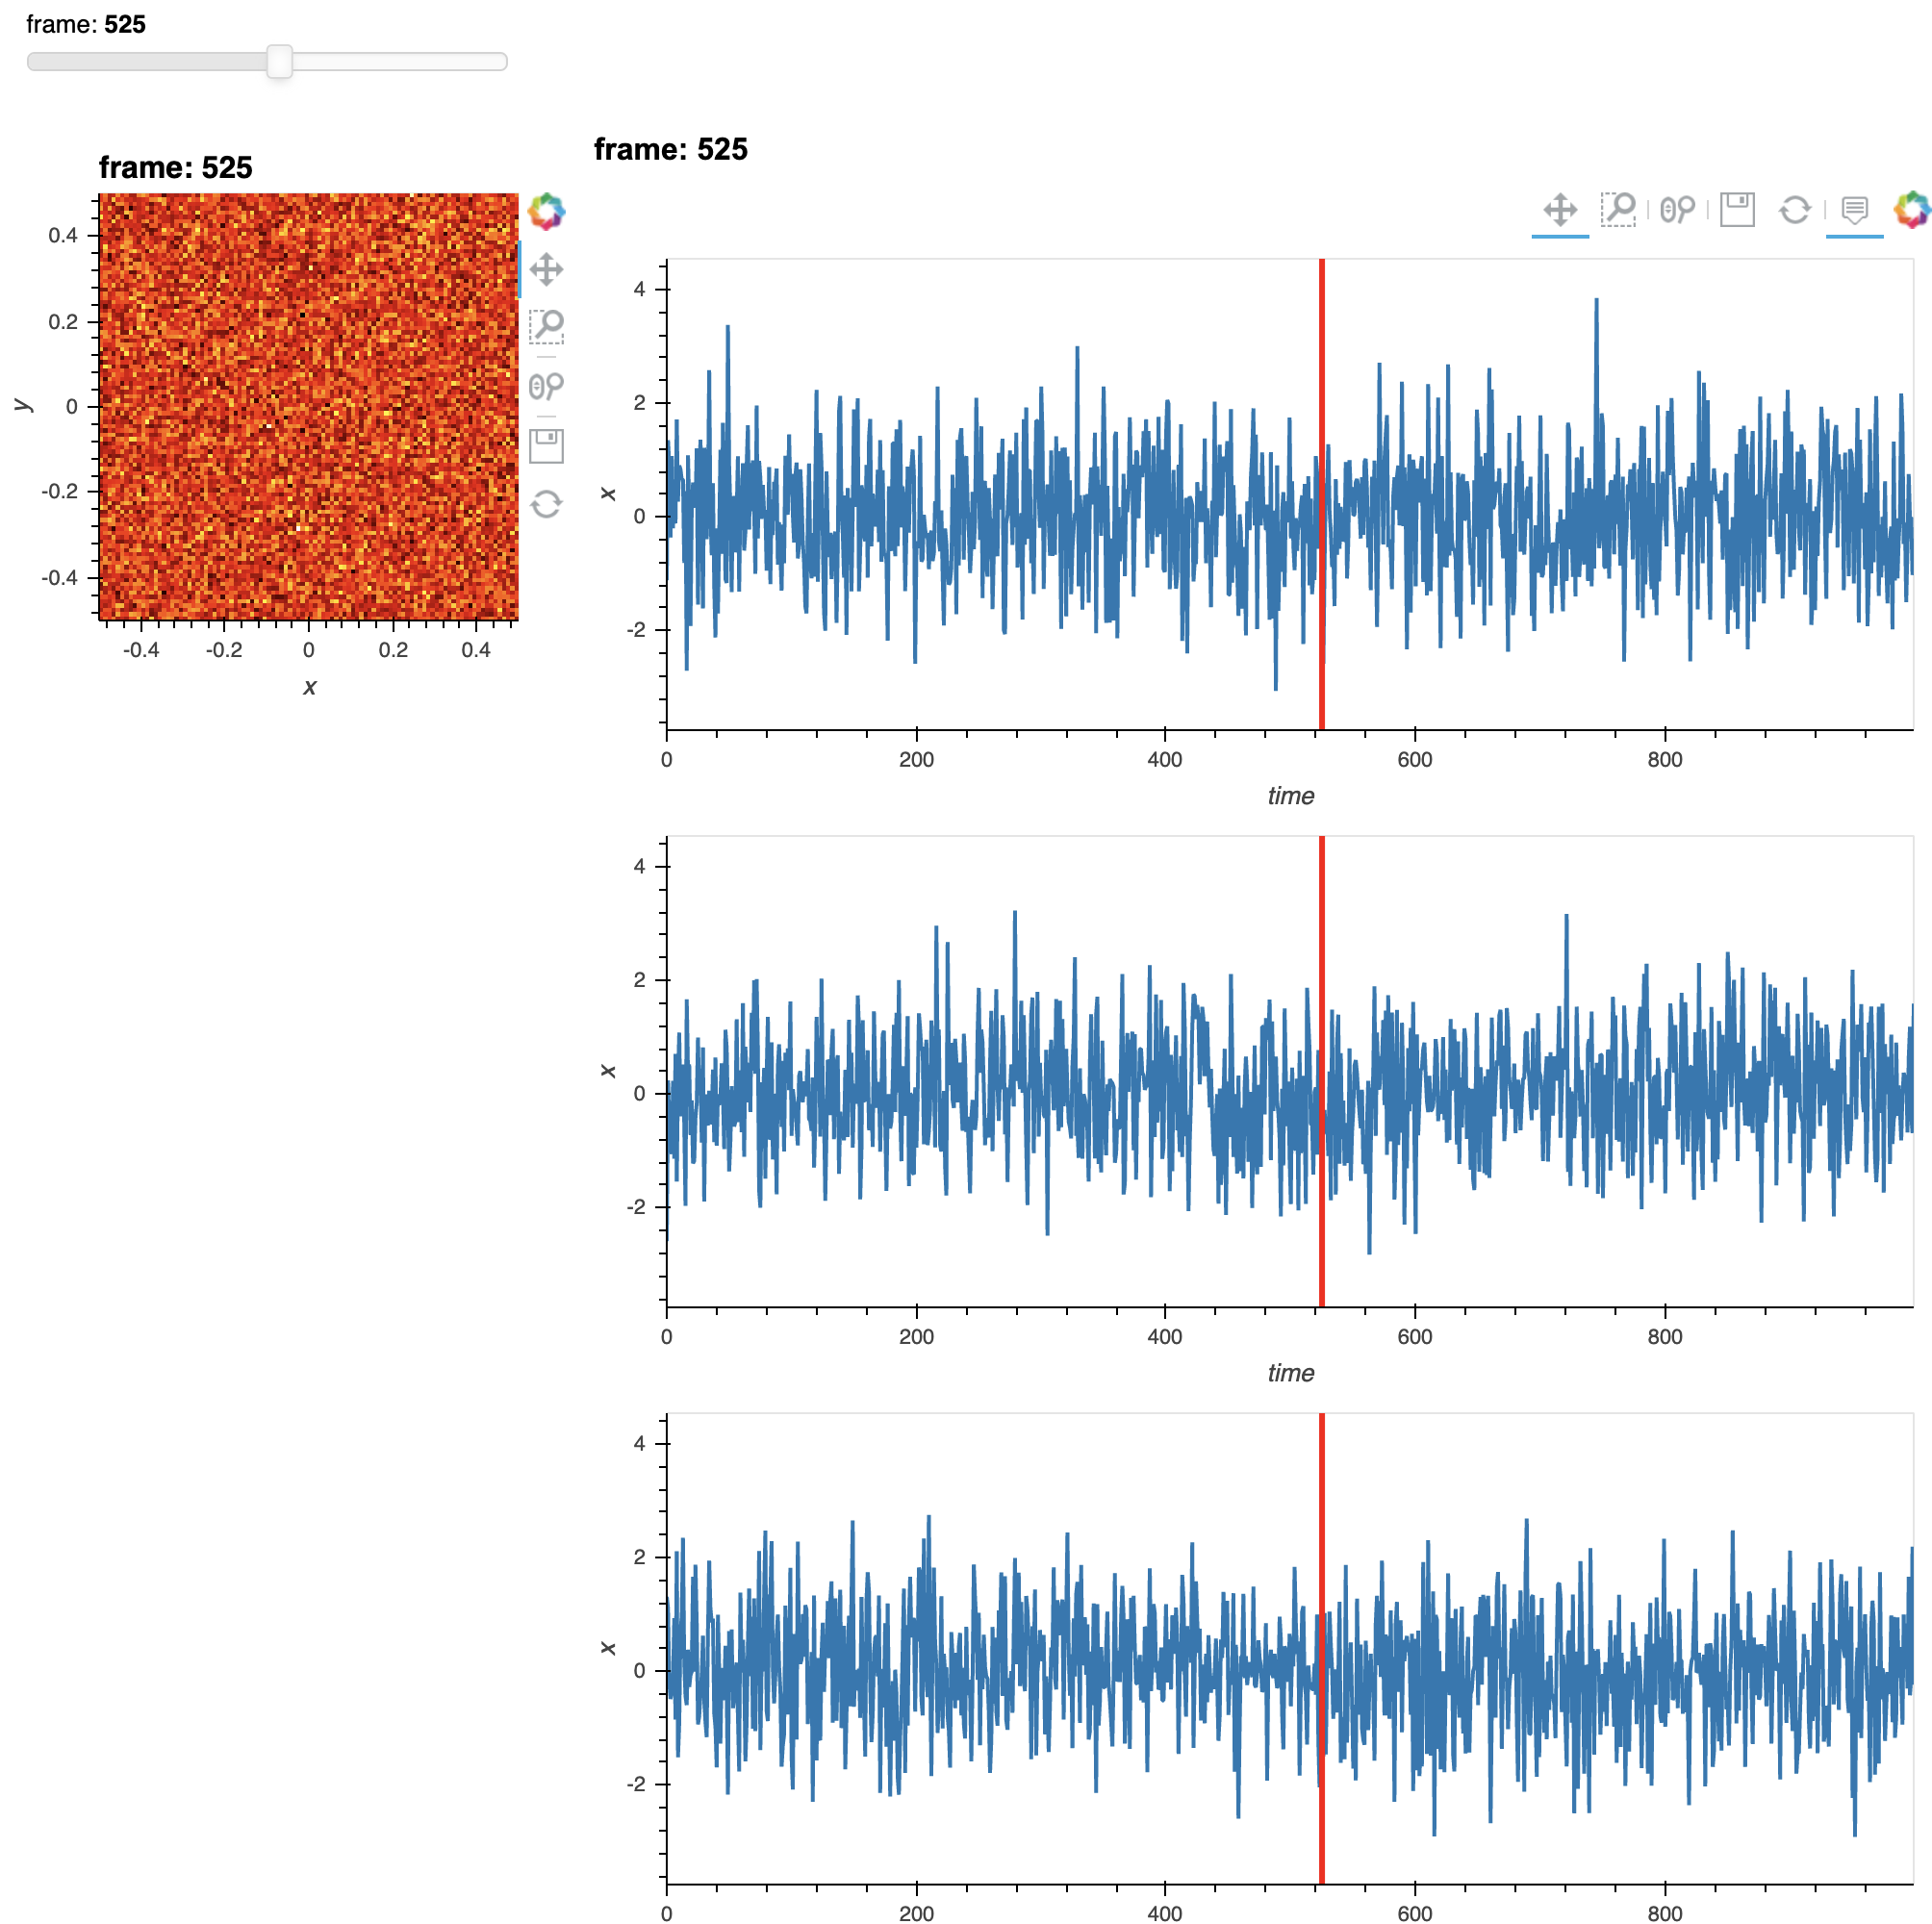
In particular, we have three components we need to scrub through, one is a video, the other two are timeseries plots for which we have a dynamic map VLine that shows us at which time step we’re at. We want to put the video on the right, the timeseries plots on the left, and the scrubber at the bottom, while taking advantage of the syntactic ease and composability of using DynamicMaps.
I believe the speed/ performance of the above could be improved if the 3 plots could be a HoloMap. I simply could not get access to the slider. If I could I could have watched the slider value for changes and update the image only when the slider changes. That should have been faster I believe.
I’d agree with @Marc that constructing the widget with Panel is the simpler approach here, however with sufficient indexing and some linking you can achieve something similar by using HoloViews:
left = pn.panel(img.opts(axiswise=True))
right = pn.panel((plot1+plot2+plot3).cols(1))

# We index the widgets from both plots and link them
left[1][0][0].link(right[1][0][0], value='value', bidirectional=True)

pn.Column(
    right[1][0][0],
    pn.Row(left[0], right[0])
)
Basically to achieve this we use pn.panel to convert our HoloViews objects to Panel objects and then index them so we get access to the widgets and plot components and then link and lay them out manually.
That said there’s also a much more efficient way to construct @Marc’s example, in that HoloViews DynamicMaps accept callbacks annotated with pn.depends and then efficiently update the plots. That would look like this, building on his existing code:
ps. I somebody could point me to a real data set for which the tool could provide some actual insights it would be really, really nice. And we could add it to the Panel Gallery I believe to help new users.