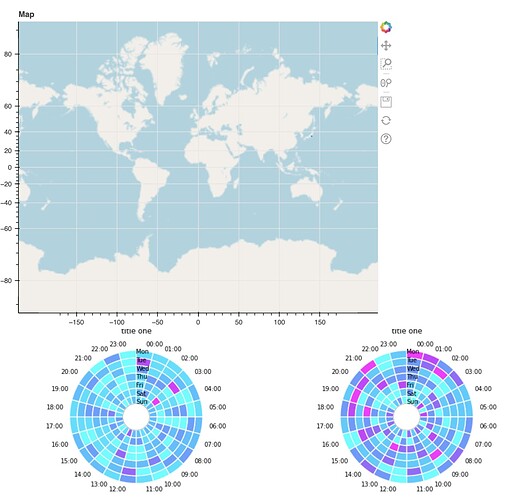
I am using a Gridspec object to display multiple objects but am struggling to get them to line up. Using sizing_mode='stretch_both' does not not stretch or shrink the objects to fit the same amount of space, so it does not make the output look better. Specifying the width argument for the row or column does not seem to have a noticeable effect. Is there an easy way to align the plots so that they line up? I would be okay with operations that stretch or shrink the plots themselves.
Code below creates the misaligned output. Quick note on the plots: the map is Bokeh and the clocks are MPL. Not sure whether that matters.
import holoviews as hv
import holoviews.plotting.bokeh
import panel as pn


pn.extension('tabulator')

gspec = pn.GridSpec(sizing_mode='stretch_both')


gspec[0, 4:7] = pn.Column(pn.Row(create_map, sizing_mode='stretch_both'), pn.Row(create_ops_gm, create_ops_gm, sizing_mode='stretch_both'))
gspec[0, 7:8] = pn.Row(date_picker)


gspec.servable()
Misaligned output is below.
