Wondering if anyone else is running into a similar issue. I am trying to wrap an pyechart example in a panel pane, but when the example includes JS passthrough code I run into a JSON decoding error.
Outside of panel, pyecharts can generate the HTML just fine.
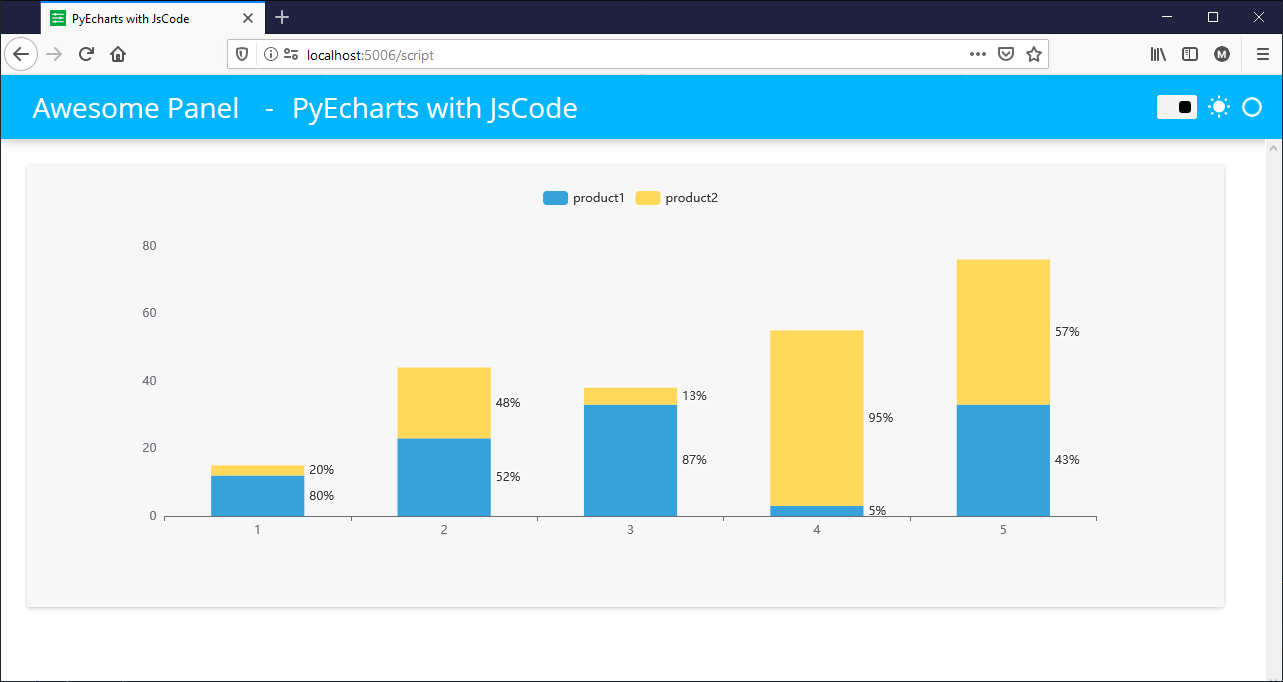
This example is pulled from Document
import panel as pn
pn.extension('echarts')

from pyecharts import options as opts
from pyecharts.charts import Bar
from pyecharts.commons.utils import JsCode
from pyecharts.globals import ThemeType

list2 = [
    {"value": 12, "percent": 12 / (12 + 3)},
    {"value": 23, "percent": 23 / (23 + 21)},
    {"value": 33, "percent": 33 / (33 + 5)},
    {"value": 3, "percent": 3 / (3 + 52)},
    {"value": 33, "percent": 33 / (33 + 43)},
]

list3 = [
    {"value": 3, "percent": 3 / (12 + 3)},
    {"value": 21, "percent": 21 / (23 + 21)},
    {"value": 5, "percent": 5 / (33 + 5)},
    {"value": 52, "percent": 52 / (3 + 52)},
    {"value": 43, "percent": 43 / (33 + 43)},
]

c = (
    Bar(init_opts=opts.InitOpts(theme=ThemeType.LIGHT))
    .add_xaxis([1, 2, 3, 4, 5])
    .add_yaxis("product1", list2, stack="stack1", category_gap="50%")
    .add_yaxis("product2", list3, stack="stack1", category_gap="50%")
    .set_series_opts(
        label_opts=opts.LabelOpts(
            position="right",
            formatter=JsCode(
                "function(x){return Number(x.data.percent * 100).toFixed() + '%';}"
            ),
        )
    ))

c.render("stack_bar_percent.html")   # This works fine without panel

pn.pane.ECharts(c) # This runs into a JSON decode error