Dear *,
We are currently working on an application that displays protein sequences and adds some annotation to the sequence to specific regions of the protein sequence or even single characters. Our approach is extremely slow and my question is if you have ideas how to either make it faster or if there are alternative ways that come to mind to display this?
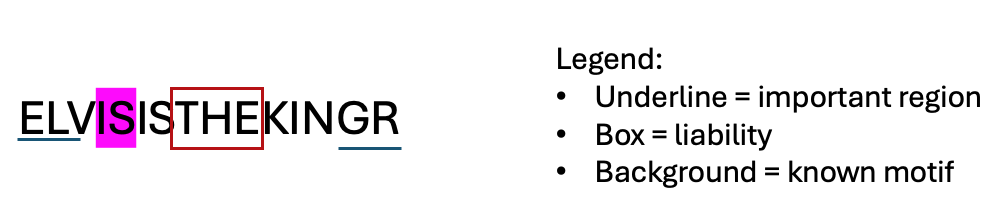
This might look like this:
ELVISISTHEKINGR
Where we then annotate the following:
- surround ELVIS with a box
- surround all Rs with a red box
- underline THE
- draw a background color around certain positions
This is just a completely made up example, we deal with sequences from 150 to 1000 characters and drawing this is extremely slow. There are 5-10 red boxes, 3-5 domains, 10-20 background colorings. We are doing something very inefficient here with all the drawings for sure, but lack the experience if there would be better ways to do this with native panel. We might need to do something more sophisticated but maybe there is something obvious we are missing before going this route.
The code uses the following snippets, most of these are in some loop I am just showing the raw code for the objects.
hv.Rectangles(data, vdims=vdims).opts(
            fill_color=fill_color,
            line_color=line_color,
            tools=["hover"],
            hover_alpha=0.6,
            hover_tooltips=[(k, f"@{k}") for k in hover_data.keys()],

hv.Text(x, y, text).opts(
        text_font="Courier New", text_align="center", text_baseline="middle", text_font_size=font_size, text_color=color
    )


hv.Segments([(start + X_OFFSET + TEXT_SHIFT, Y_OFFSET, end + X_OFFSET + TEXT_SHIFT, Y_OFFSET)]).opts(
                color=GREEN_COLOR, line_width=LINE_WIDTH
            )

hover = hv.Points(hover_points, kdims=["x", "y"], vdims=["Position", "Residue", "Annotation"]).opts(
        tools=["hover"],
        size=5,
        alpha=0,
        hover_alpha=0.3,
        nonselection_alpha=0,
        color="black",
        hover_tooltips=[
            ("Position", "@Position"),
            ("Residue", "@Residue"),
            ("Annotation", "@Annotation"),
        ],
    )

overlay = hv.Overlay(background_boxes + sequence_letters + underlines + annotation_texts + [hover]).opts(
        yaxis=None,
        xlabel="",
        bgcolor=background_color,
        background_fill_color=background_color,
        toolbar=None,
        width=DEFAULT_WIDTH_MULTIPLIER * len(sequence),
        height=DEFAULT_HEIGHT,
        show_grid=False,
        active_tools=[],
        shared_axes=False,
        show_frame=False,
        xlim=(-X_AXIS_PADDING, len(sequence) + X_AXIS_PADDING),
        framewise=False,
    )