Hi, I am using Holoview and tried to create an interactive hv.DynamicMap.
this is a chunk of the code:
posxy = hv.streams.Tap(source=soundspeed, x=startDate)
def tap_date(x, y):
date = pd.to_datetime(x)
strDate = str(date.date())
return hv.Scatter(data[strDate], label=f’{strDate}: Speed of Sound [m/s] vs Depth[m]’)
tap_dmap = hv.DynamicMap(tap_date, streams=[posxy])
(soundspeed + tap_dmap).opts(
opts.Image(
title=locationName + " Speed of Sound with Depth vs Time",
width=600, height=500,
tools=[‘hover’],
ylabel=‘Depth [m]’,
invert_yaxis=True,
ylim=(0,250),
xlabel=‘Date’,
cmap=‘viridis’,
colorbar=True,
),
opts.Scatter(
framewise=True,
width=375, height=500,
tools=[‘hover’],
invert_axes=True,
ylabel=‘Speed of Sound [m/s]’,
yaxis=‘right’,
invert_yaxis=True,
ylim=(1460, 1520),
xlabel=‘Depth’,
xlim=(0,200),
),
)
the effect looks like:
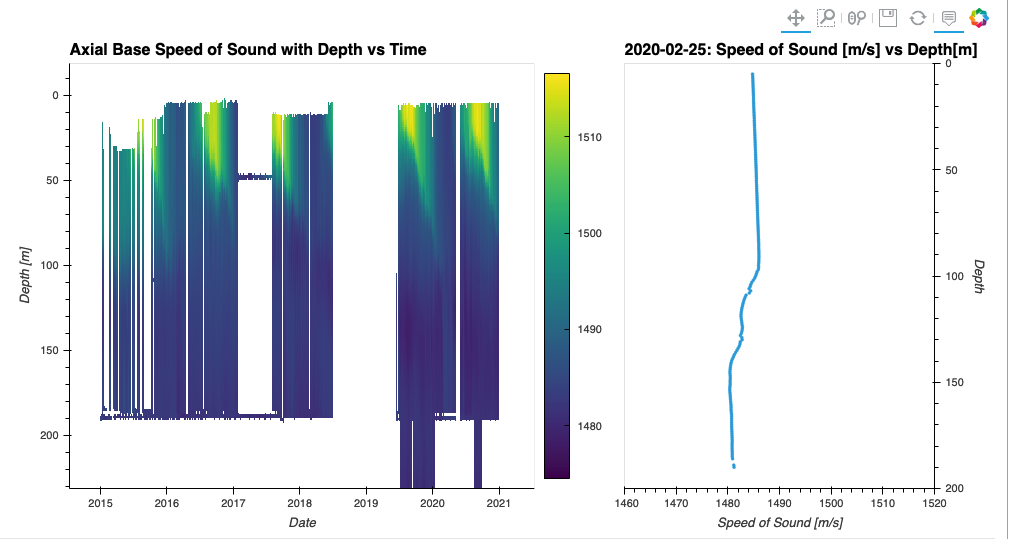
basically when you click on left graph, the right graph will get updated to a new graph.However, this interaction only work on Jupyter notebook, when I use “hvplot.save(graph, ‘test2.html’)” and save this interactive graph into a html file, the interactivity disappear, when you click the left graph again, the right graph no longer gets updated. I am wondering how to enable this interaction in html again?
let me know if you need any other info