Error: not supported between instances of 'Select' and 'Select'

Hi Panel community,

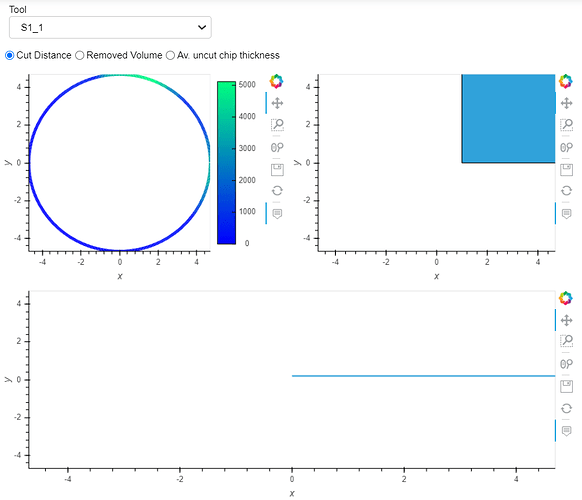
I have a little problem with one dashoard. I want to achieve something looking like this:

import param
import numpy as np
import pandas as pd
import panel as pn
import holoviews as hv
import bokeh
from bokeh.resources import INLINE

hv.extension('bokeh') 
pn.extension()

data_A=pd.read_csv('data_A.csv',index_col=0)
data_B=pd.read_csv('data_B.csv',index_col=0)


Tool = pn.widgets.Select(name='S1_1', options=['S1_1','S2_1'])
Variable = pn.widgets.RadioBoxGroup(name='Variable', options=['Cut Distance', 'Removed Volume', 'Av. uncut chip thickness'], inline=True)


# Insert plot
@pn.depends(Tool.param.value,Variable.param.value)
def insert_plot(Tool,Variable):
    xs=data_A.loc[Tool]['Xo']
    ys=data_A.loc[Tool]['Yo']
    zs=data_A.loc[Tool][Variable]
    plot=hv.Path([{'x': xs, 'y': ys, 'z': zs}],vdims='z')
    return plot.opts(colorbar=True,color='z', cmap='winter',line_width=4, height=300, width=400, tools=['hover'])

# Edge plot
@pn.depends(Tool.param.value,Variable.param.value)
def edge_plot(Variable,Tool):
    x=np.array(list(data_A.loc[Tool]['Number']))
    y=np.array(list(data_A.loc[Tool][Variable]))
    plot = hv.Area((x,y))
    return plot.opts(height=300, width=400, tools=['hover'])

# History plot
@pn.depends(Tool.param.value)
def history_plot(Tool):
    x=np.array(list(data_B.loc[Tool]['Cut Distance']))
    y=np.array(list(data_B.loc[Tool]['Feed']))
    points=[[x[i],y[i]] for i in range(len(x))]
    plot = hv.Curve(points)
    return plot.opts(height=300, width=800, tools=['hover'])

dashboard = pn.Column(pn.Column(Tool,Variable),
                      pn.Row(insert_plot(Tool,Variable),edge_plot(Variable,Tool)),
                      history_plot(Tool)
                     )

dashboard

the error I get reffers to the function insert_plot(Tool, Variable) and looks like this:

TypeError: '<' not supported between instances of 'Select' and 'Select'

can anyone guess what am I doing wrong?

Thanks a lot!

Hi, could you paste sample of your data frames (data_A and data_B)?

Hi @tmikolajczyk,

here is the data:

data_A.csv (62.9 KB) data_B.csv (6.5 KB)

Hi @pemp

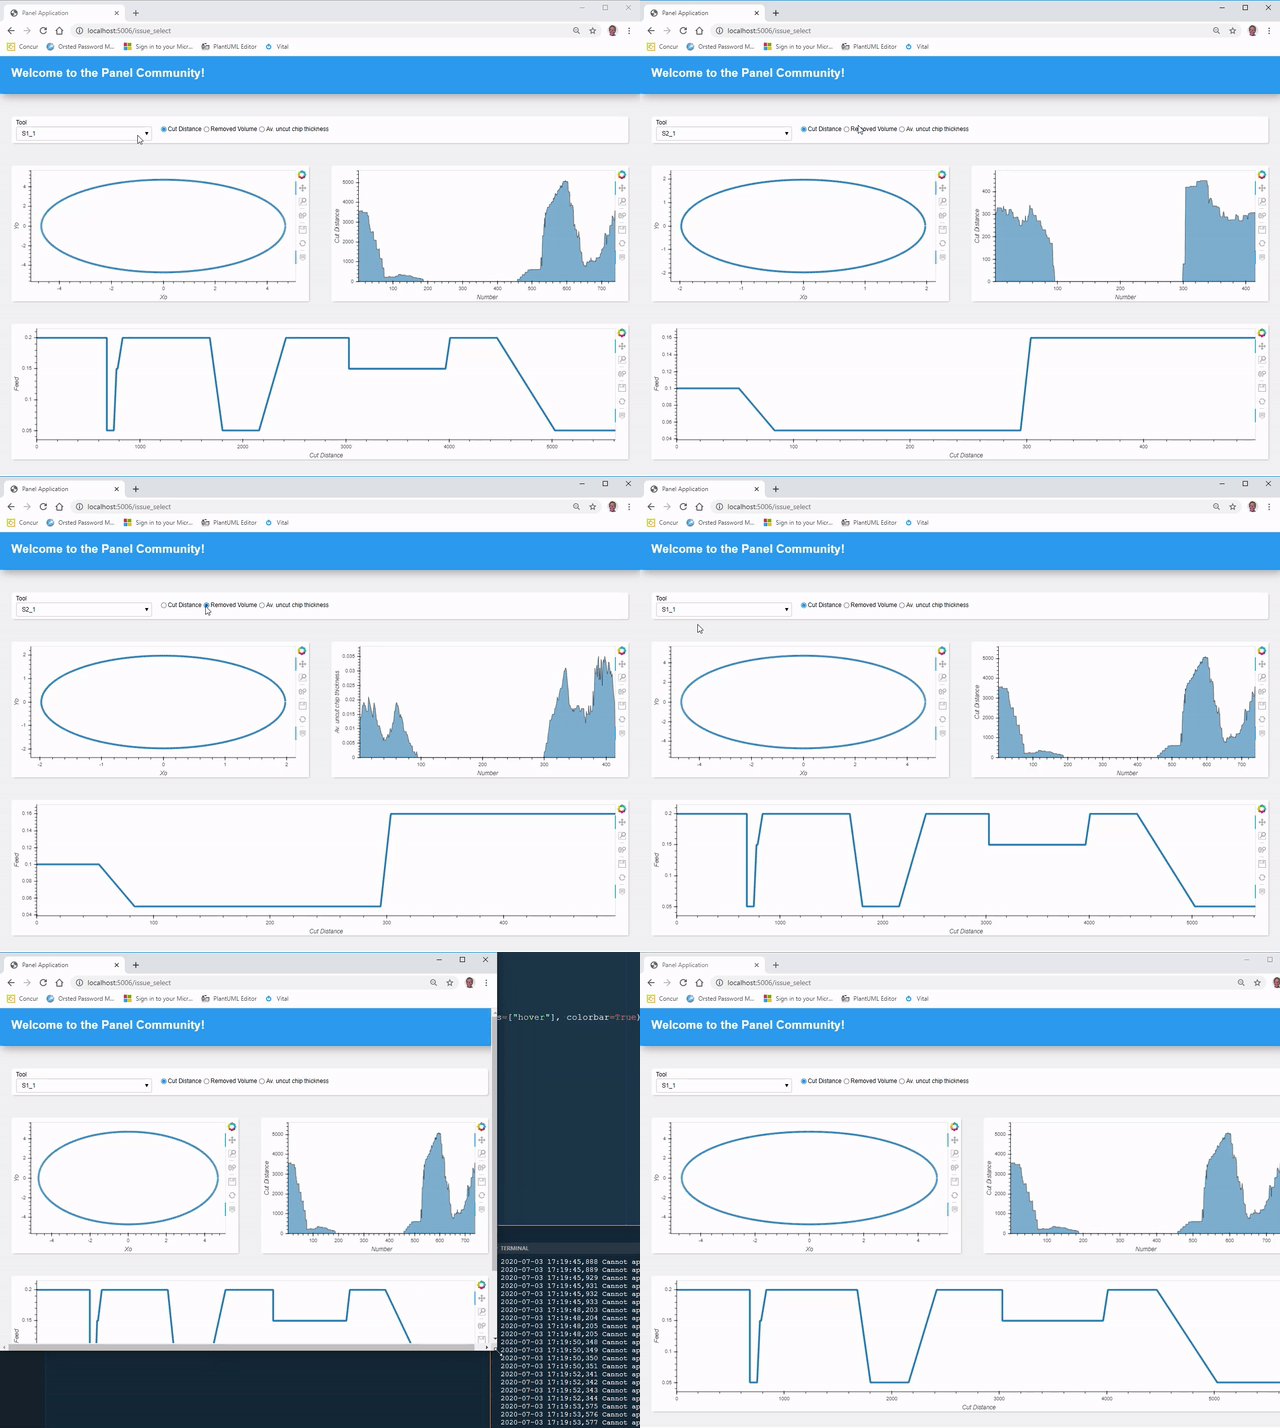
One of the problems was the use of Tool and Variable for the widget and as parameters to your function. For some reason the first time the function was called Tool and Variable held the widgets and not their values.

I’ve played a little bit around with it.

dashboard

import param

import numpy as np

import pandas as pd

import panel as pn

import holoviews as hv

import bokeh

from bokeh.resources import INLINE

import hvplot.pandas

hv.extension("bokeh")

pn.extension()

pn.config.sizing_mode = "stretch_width"

STYLE = """

body {

    margin: 0px;

}

.bk.app-body {

    background: #f2f2f2;

    color: #000000;

    font-family: roboto, sans-serif, Verdana;

}

.bk.app-bar {

    background: #2196F3;

    border-color: white;

    box-shadow: 5px 5px 20px #9E9E9E;

    color: #ffffff;

    z-index: 50;

}

.bk.app-container {

    background: #ffffff;

    border-radius: 5px;

    box-shadow: 2px 2px 2px lightgrey;

    color: #000000;

}

.bk.app-settings {

    background: #e0e0e0;

    color: #000000;

}

"""

pn.config.raw_css.append(STYLE)

try:

    data_A = pd.read_csv("data_A.csv", index_col=0)

except Exception as e:

    data_A = pd.read_csv(

        "https://discourse.holoviz.org/uploads/short-url/ceLgCS43UtYgICERGGnBpTxG4UX.csv",

        index_col=0,

    )

    data_A.to_csv("data_A.csv")

try:

    data_B = pd.read_csv("data_B.csv", index_col=0)

except Exception as e:

    data_B = pd.read_csv(

        "https://discourse.holoviz.org/uploads/short-url/mLsBXvpSQTex5rU6RZpzsaxOe5b.csv",

        index_col=0,

    )

    data_B.to_csv("data_B.csv")

Tool = pn.widgets.Select(name="Tool", options=["S1_1", "S2_1"], sizing_mode="fixed")

Variable = pn.widgets.RadioBoxGroup(

    name="Variable",

    options=["Cut Distance", "Removed Volume", "Av. uncut chip thickness"],

    inline=True,

    align="center",

)

# Insert plot

@pn.depends(Tool.param.value, Variable.param.value)

def insert_plot(tool_value, variable_value):

    plot_data = data_A.loc[tool_value]

    return plot_data.hvplot(x="Xo", y="Yo", kind="paths", line_width=4, tools=["hover"], colorbar=True).opts(cmap="winter")

    # xs = data_A.loc[tool_value]["Xo"]

    # ys = data_A.loc[tool_value]["Yo"]

    # zs = data_A.loc[tool_value][variable_value]

    # plot = hv.Path([{"x": xs, "y": ys, "z": zs}], vdims="z")

    # return plot.opts(

    #     colorbar=True,

    #     color="z",

    #     cmap="winter",

    #     line_width=4,

    #     height=300,

    #     width=400,

    #     tools=["hover"],

    # )

# Edge plot

@pn.depends(Tool.param.value, Variable.param.value)

def edge_plot(tool_value, variable_value):

    plot_data = data_A.loc[tool_value]

    return plot_data.hvplot(

        x="Number", y=variable_value, height=300, kind="area", alpha=0.6, tools=["hover"]

    )

# History plot

@pn.depends(Tool.param.value)

def history_plot(tool_value):

    plot_data = data_B.loc[tool_value]

    return plot_data.hvplot(x="Cut Distance", y="Feed", kind="line", height=300, line_width=4).opts(

        tools=["hover"]

    )

dashboard = pn.Column(

    pn.Row(pn.pane.Markdown("# Welcome to the Panel Community! ", margin=(10,5,10,25)), css_classes=["app-bar"]),

    pn.Row(Tool, Variable, css_classes=["app-container"], margin=(50,25,25,25)),

    pn.Row(

        pn.Column(insert_plot, css_classes=["app-container"], margin=25),

        pn.Column(edge_plot, css_classes=["app-container"], margin=25),

    ),

    pn.Row(history_plot, css_classes=["app-container"], margin=25),

    pn.Spacer(),

    css_classes=["app-body"], sizing_mode="stretch_both",

)

if __name__.startswith("bokeh"):

    dashboard.servable()

else:

    dashboard.show(port=5007)
1 Like

Unfortunately I could not get color on the Path plot (The circle). I hope someone else can solve that problem.

If you like Panel or the above example or think Panel could deserve a little love and attention. Feel free to share my tweet about this example here https://twitter.com/MarcSkovMadsen/status/1279073935733252096?s=20.

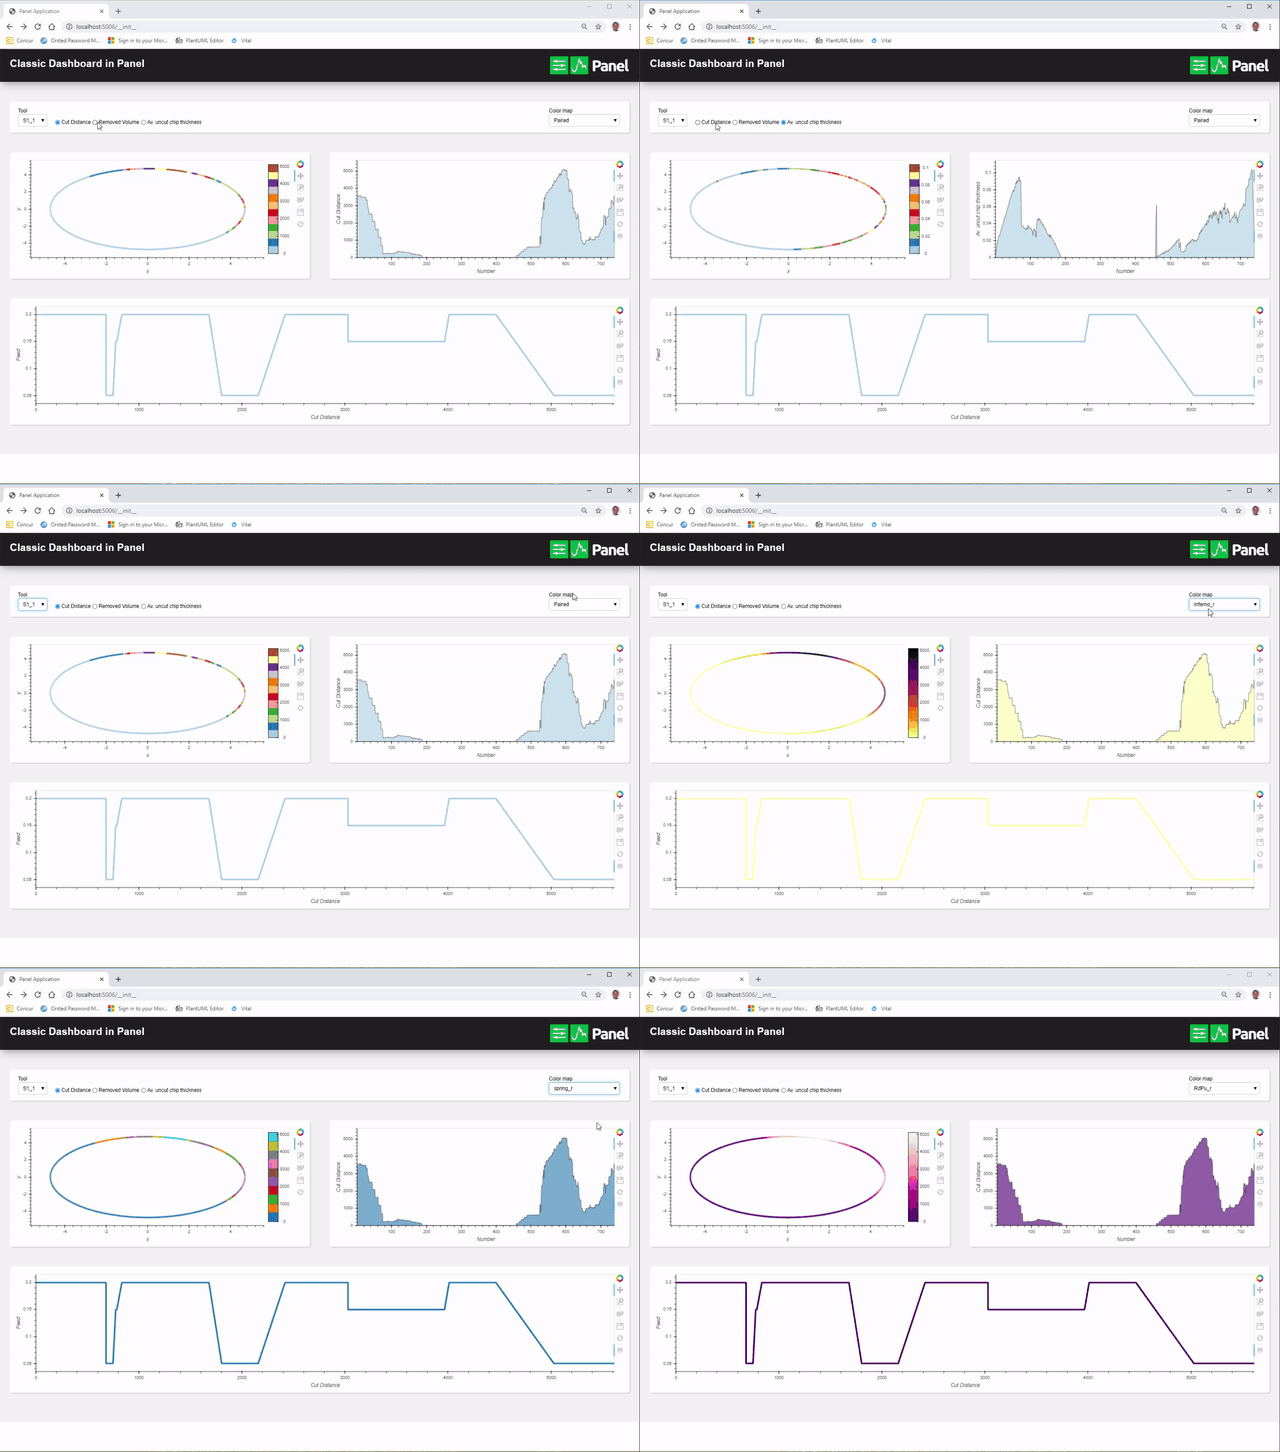
I thought this problem is really the basic problem of creating a dashboard. So thought it worth investigating a bit more.
dashboard-classic

from logging import setLogRecordFactory
import param
import numpy as np
import pandas as pd
import panel as pn
import holoviews as hv
import bokeh
import hvplot.pandas
from holoviews.plotting.util import process_cmap


hv.extension("bokeh")
pn.extension()
pn.config.sizing_mode = "stretch_width"

EMPTY_PLOT = hv.Curve({})
COLOR_MAPS = hv.plotting.util.list_cmaps()
STYLE = """
body {
    margin: 0px;
    min_height: 100vh;
}
.bk.app-body {
    background: #f2f2f2;
    color: #000000;
    font-family: roboto, sans-serif, Verdana;
}
.bk.app-bar {
    background: #212121;
    border-color: white;
    box-shadow: 5px 5px 20px #9E9E9E;
    color: #ffffff;
    z-index: 50;
}
.bk.app-container {
    background: #ffffff;
    border-radius: 5px;
    box-shadow: 2px 2px 2px lightgrey;
    color: #000000;
}

.bk.app-settings {
    background: #e0e0e0;
    color: #000000;
}

"""

pn.config.raw_css.append(STYLE)

try:
    data_A = pd.read_csv("data_A.csv", index_col=0)
except Exception as e:
    data_A = pd.read_csv(
        "https://discourse.holoviz.org/uploads/short-url/ceLgCS43UtYgICERGGnBpTxG4UX.csv",
        index_col=0,
    )
    data_A.to_csv("data_A.csv")

try:
    data_B = pd.read_csv("data_B.csv", index_col=0)
except Exception as e:
    data_B = pd.read_csv(
        "https://discourse.holoviz.org/uploads/short-url/mLsBXvpSQTex5rU6RZpzsaxOe5b.csv",
        index_col=0,
    )
    data_B.to_csv("data_B.csv")

Variable = pn.widgets.RadioBoxGroup(
    name="Variable",
    options=["Cut Distance", "Removed Volume", "Av. uncut chip thickness"],
    inline=True,
    align="center",
)

# Insert plot
class PempDashoardApp(param.Parameterized):
    tool = param.ObjectSelector(label="Tool", default="S1_1", objects=["S1_1", "S2_1"])
    variable = param.ObjectSelector(
        label="Variable",
        default="Cut Distance",
        objects=["Cut Distance", "Removed Volume", "Av. uncut chip thickness"],
    )
    color_map = param.ObjectSelector(default="winter", objects=COLOR_MAPS)

    insert_plot_pane = param.ClassSelector(class_=pn.pane.HoloViews)
    edge_plot_pane = param.ClassSelector(class_=pn.pane.HoloViews)
    history_plot_pane = param.ClassSelector(class_=pn.pane.HoloViews)

    view = param.ClassSelector(class_=pn.Column)

    def __init__(self, **params):
        params["insert_plot_pane"] = pn.pane.HoloViews(EMPTY_PLOT, sizing_mode="stretch_both", margin=10)
        params["edge_plot_pane"] = pn.pane.HoloViews(EMPTY_PLOT, sizing_mode="stretch_both", margin=10)
        params["history_plot_pane"] = pn.pane.HoloViews(EMPTY_PLOT, sizing_mode="stretch_both", margin=10)
        params["view"] = pn.Column(css_classes=["app-body"], sizing_mode="stretch_both", margin=0)

        super().__init__(**params)

        self._init_view()
        self._update_insert_plot()
        self._update_edge_plot()
        self._update_history_plot()

    def _init_view(self):
        appbar = pn.Row(
            pn.pane.Markdown("# Classic Dashboard in Panel ", margin=(10, 5, 10, 25)),
            pn.Spacer(height=0),
            pn.pane.PNG(
                "https://panel.holoviz.org/_static/logo_horizontal.png",
                width=200,
                sizing_mode="fixed",
                align="center",
                margin=(10, 50, 10, 5),
            ),
            css_classes=["app-bar"],
        )
        settings_bar = pn.Row(
            pn.Param(
                self,
                parameters=["tool", "variable"],
                widgets={
                    "tool": {"align": "center", "width": 75, "sizing_mode": "fixed"},
                    "variable": {"type": pn.widgets.RadioBoxGroup, "inline": True, "align": "end",},
                },
                default_layout=pn.Row,
                show_name=False,
                align="center",
            ),
            pn.Spacer(height=0),
            pn.Param(
                self,
                parameters=["color_map"],
                width=200,
                align="center",
                sizing_mode="fixed",
                show_name=False,
                margin=(10, 25, 10, 5),
            ),
            sizing_mode="stretch_width",
            css_classes=["app-container"],
            margin=(50, 25, 25, 25),
        )

        self.view[:] = [
            appbar,
            settings_bar,
            pn.Row(
                pn.Column(self.insert_plot_pane, css_classes=["app-container"], margin=25),
                pn.Column(self.edge_plot_pane, css_classes=["app-container"], margin=25),
            ),
            pn.Row(self.history_plot_pane, css_classes=["app-container"], margin=25),
            pn.layout.VSpacer(),
            pn.layout.VSpacer(),
        ]

    @pn.depends("tool", "variable", "color_map", watch=True)
    def _update_insert_plot(self):
        plot_data = data_A.loc[self.tool]
        data = [(plot_data["Xo"], plot_data["Yo"], plot_data[self.variable])]
        self.insert_plot_pane.object = hv.Path(data, vdims=self.variable).opts(
            cmap=self.color_map, color=self.variable, line_width=4, colorbar=True
        )

    @pn.depends("tool", "variable", "color_map", watch=True)
    def _update_edge_plot(self):
        plot_data = data_A.loc[self.tool]
        self.edge_plot_pane.object = plot_data.hvplot(
            x="Number", y=self.variable, kind="area", alpha=0.6, color=self.get_color
        )

    @pn.depends("tool", "color_map", watch=True)
    def _update_history_plot(self):
        plot_data = data_B.loc[self.tool]
        self.history_plot_pane.object = plot_data.hvplot(
            x="Cut Distance", y="Feed", kind="line", line_width=4
        ).opts(color=self.get_color)

    @property
    def get_color(self):
        return process_cmap(self.color_map, 1)[0]


def view():
    return PempDashoardApp().view


if __name__.startswith("bokeh"):
    view().servable()
else:
    view().show(port=5007)
I’ve added the Dashboard app to the gallery at awesome-panel.org. It’s live and kicking there :-).

See also Awesome-panel.org change log

Hi @Marc,

thank you very much for your contribution, it has nailed it and it’s exactly what I wanted to get. I just have on more issue I am not quite sure how to get it done.

I would like to get a HTML rather than a server based app, in order to share it as a stand alone file. Of course it is fundamental that all interactivity of the widgets is preserved. I am trying to achieve it by doing this:

view().save('test', embed=True, resources=INLINE)

As a result I get a HTML file but still with no interactivity. Does anyone know how to achieve it? It would be of great help!

2 Likes

Hi @pemp

I actually never export to a static file. I hope somebody else can help.

Marc

Alright, since the original purpose of this thread has already been solved I will open a new issue focusing on the HTML export to get more feedback.

Thanks again for the great help @Marc

1 Like