Hello,
I am trying to make a datashader enabled plot with hvplot. I have the following dataset in xarray:
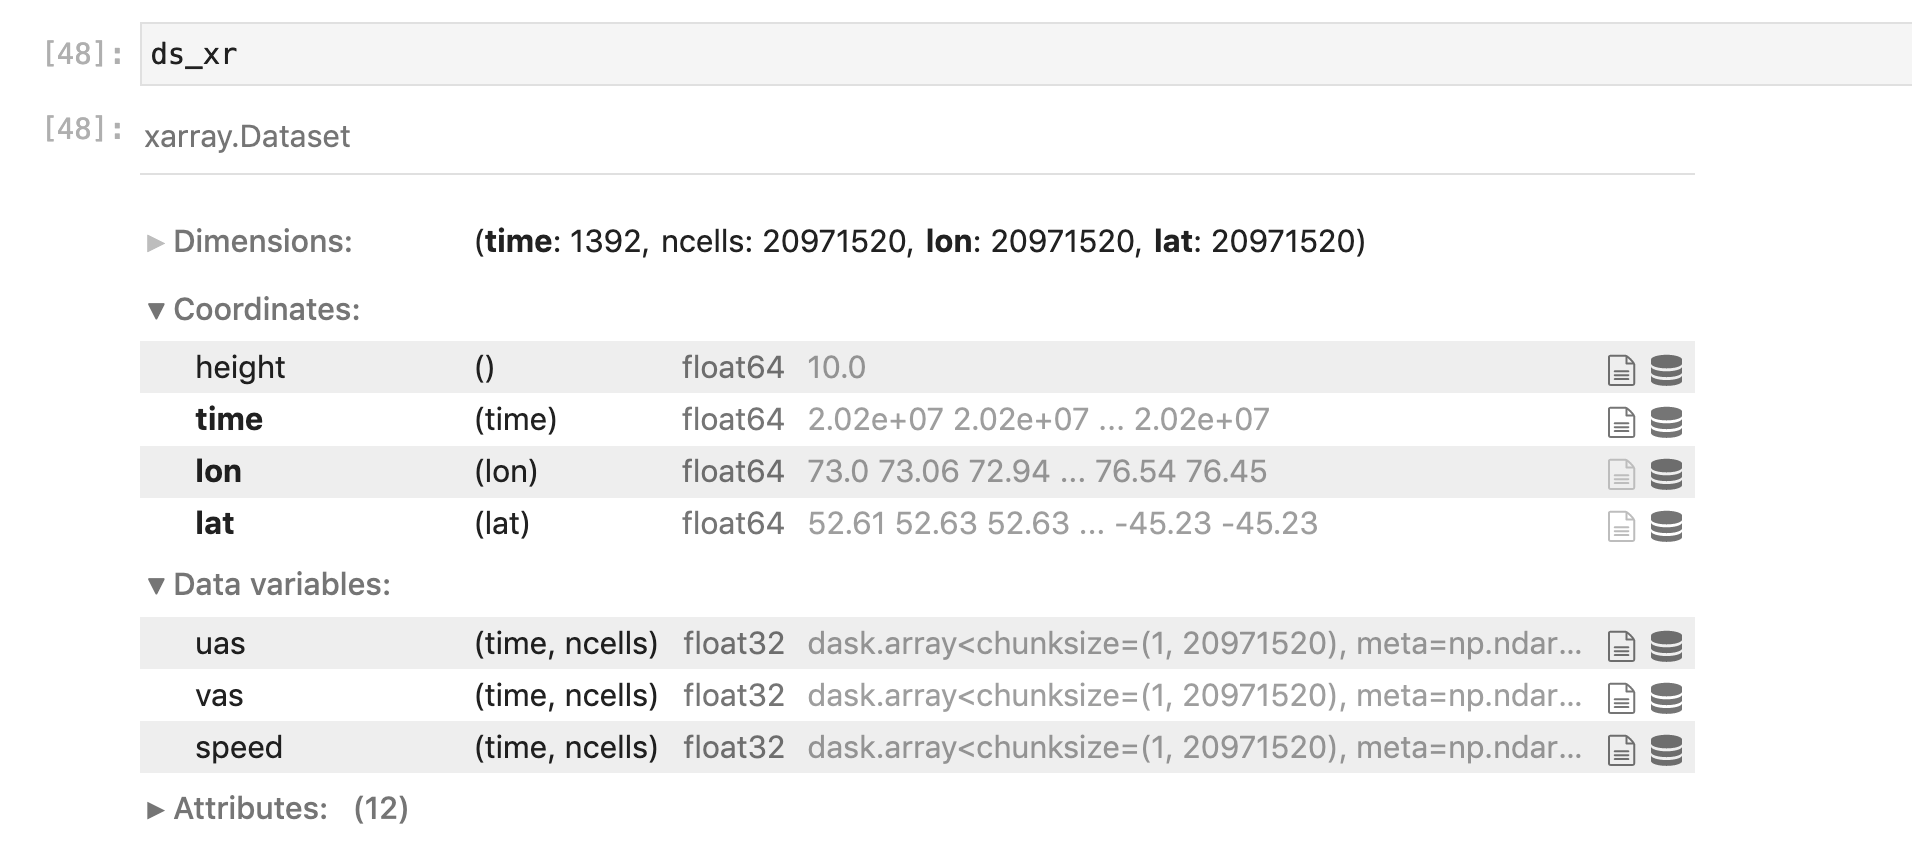
If i just select one time step, and turn into a dataframe, I can do the following:
df_zr = pd.DataFrame.from_dict({"lat": ds_xr.lat, "lon": ds_xr.lon, "speed": ds_xe.speed})
import geoviews as gv
points = gv.Points(xr_df, vdims=["speed"], kdims=["lon", "lat"])
from holoviews.operation.datashader import datashade, shade, dynspread, spread, rasterize
dynspread(
    rasterize(points, aggregator="mean")
    .opts(tools=['hover'], cmap="bjy", width=800, height=600),
    threshold=0.8,
) * gv.feature.coastline
That works nicely. I have thought something similar would be possible with hvplot? This does not work, I would be happy for any help!
ds_xr.speed.isel(time=[0]).hvplot.scatter(x="lon", y="lat", datashade=True, rasterize=True)
Or, with groupb also does not work:
ds_xr.speed.hvplot.scatter(x="lon", y="lat", datashade=True, rasterize=True, groupby="time")