Exclude combined plot from linked_selection

TLDR; How to exclude a combined plot from a linked_selection ?

I have several plots linked together. It looks like this :

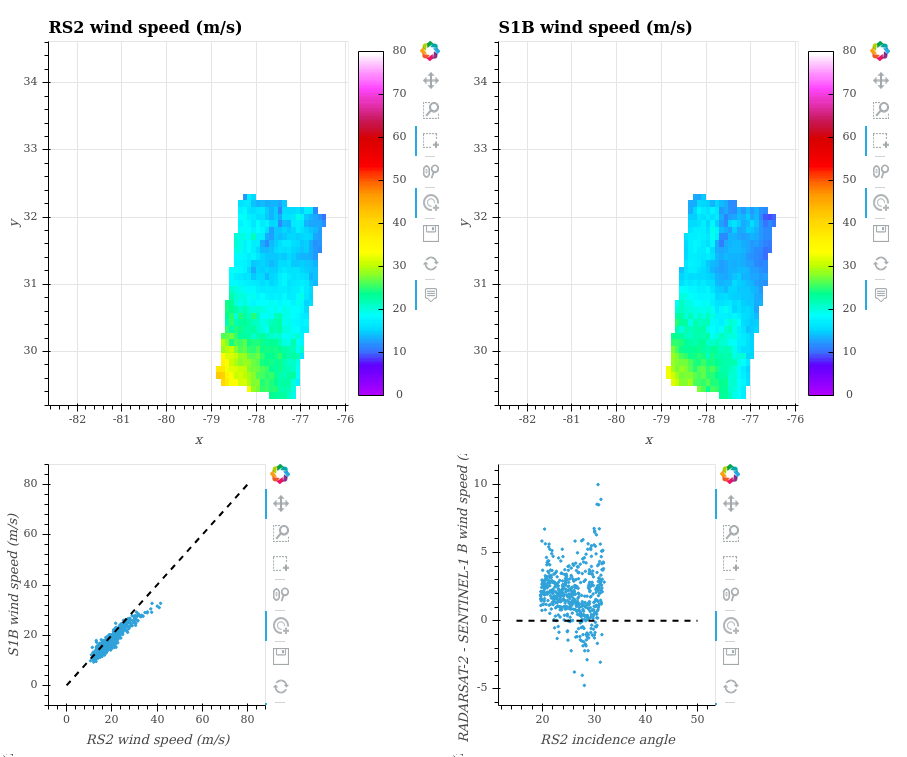
One of them (ie. the bottom left one) is defined like this:

        curve = hv.Curve([[0, 0], [80, 80]], dict_axis[key][0], dict_axis[key][1])
        curve.opts(line_dash='dashed', color='black')

        plot = (
            hv.Scatter(ds, dict_axis[key][0], dict_axis[key][1]).\
                opts(tools=['tap', 'box_select', 'wheel_zoom', 'hover']) \
            * curve
        )

I link the plots with
link_selections(layout)

When I’m selecting data I’ve got an error, due to the fact that the plot “curve” is not using data from the dataset (its goal is only to display a reference line).

So i’d like to either prevent that plot from being selected, or to exclude it from the linked_selection. (Or any other solution)

Thanks !

The error is the following :
linked_selection aborted because it could not display selection for all elements: One or more dimensions in the expression ((dim('x')>=-7913051994292739)&(dim('x')<=-7814783158566145))&((dim('y')>=29282524130020203)&(dim('y')<=3020558102669252)) could not resolve on ':Dataset [RS2 wind speed (m/s)] (S1B wind speed (m/s))' Ensure all dimensions referenced by the expression arepresent on the supplied object on ':Curve [RS2 wind speed (m/s)] (S1B wind speed (m/s))'.

Create a link_selections instance and then run it on the individual components before composing the layout, e.g.

ls = link_selections.instance()

ls(curve) + area + ls(scatter)
1 Like