Using the built in widget for time selection in hvplot is working fine, but I can’t get the explicit widget working – updating the widget value does not update the plot. What am I missing?
Full notebook here: Jupyter Notebook Viewer
Using the built in widget for time selection in hvplot is working fine, but I can’t get the explicit widget working – updating the widget value does not update the plot. What am I missing?
Full notebook here: Jupyter Notebook Viewer
I’m personally a fan of pn.bind
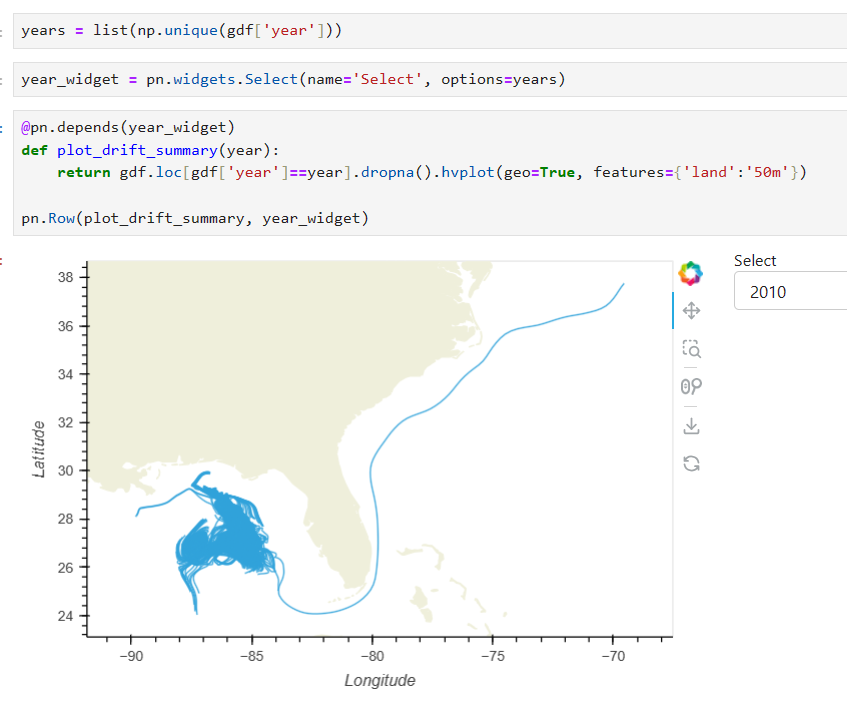
years = list(np.unique(gdf['year']))
year_widget = pn.widgets.Select(name='Select', options=years)

def plot_drift_summary(year):
    return gdf.loc[gdf['year']==year].dropna().hvplot(geo=True, features={'land':'50m'})

drift_summary = pn.bind(plot_drift_summary, year_widget)
pn.Row(drift_summary, year_widget)
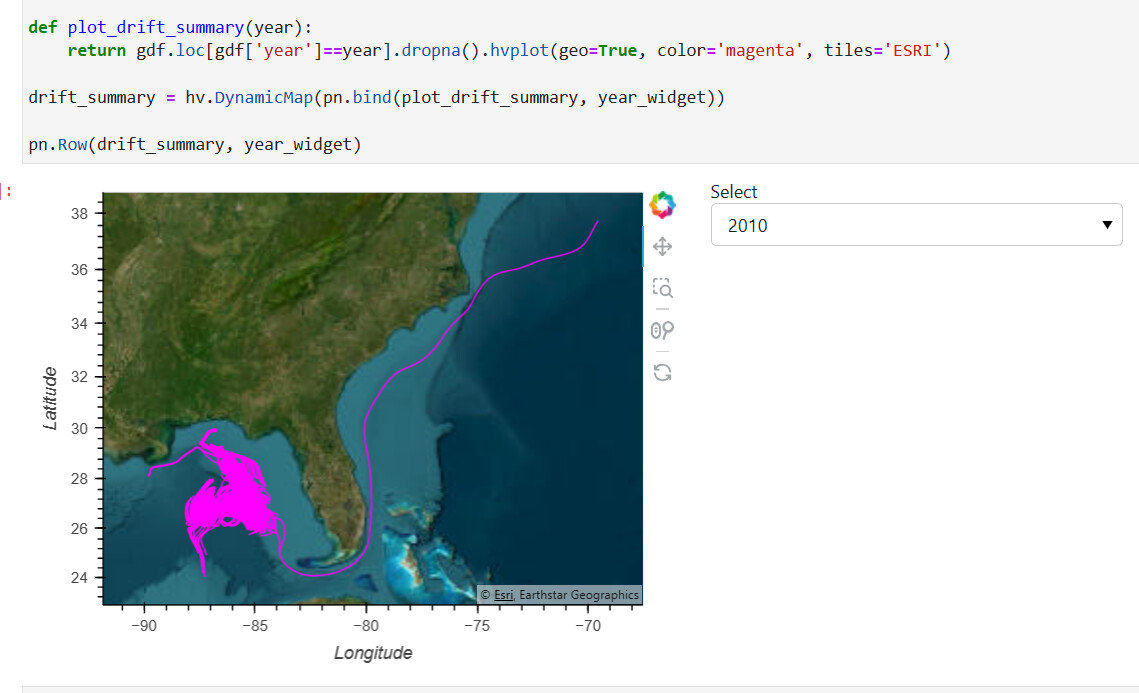
Also, wrapping it in a DynamicMap makes it not lose its zoom.
drift_summary = hv.DynamicMap(pn.bind(plot_drift_summary, year_widget))
Thanks @ahuang11 ! I didn’t know that DynamicMap would achieve that! Indeed it’s quite common to want to preserve the view while switching parameters!
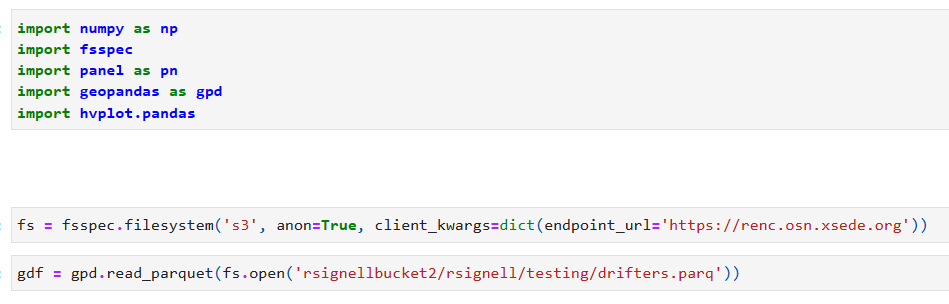
Using this code:
import numpy as np
import fsspec
import panel as pn
import geopandas as gpd
import hvplot.pandas
import holoviews as hv
fs = fsspec.filesystem('s3', anon=True, client_kwargs=dict(endpoint_url='https://renc.osn.xsede.org'))
gdf = gpd.read_parquet(fs.open('rsignellbucket2/rsignell/testing/drifters.parq'))
years = list(np.unique(gdf['year']))
year_widget = pn.widgets.Select(name='Select', options=years)
def plot_drift_summary(year):
return gdf.loc[gdf['year']==year].dropna().hvplot(geo=True, color='magenta', tiles='ESRI')
drift_summary = hv.DynamicMap(pn.bind(plot_drift_summary, year_widget))
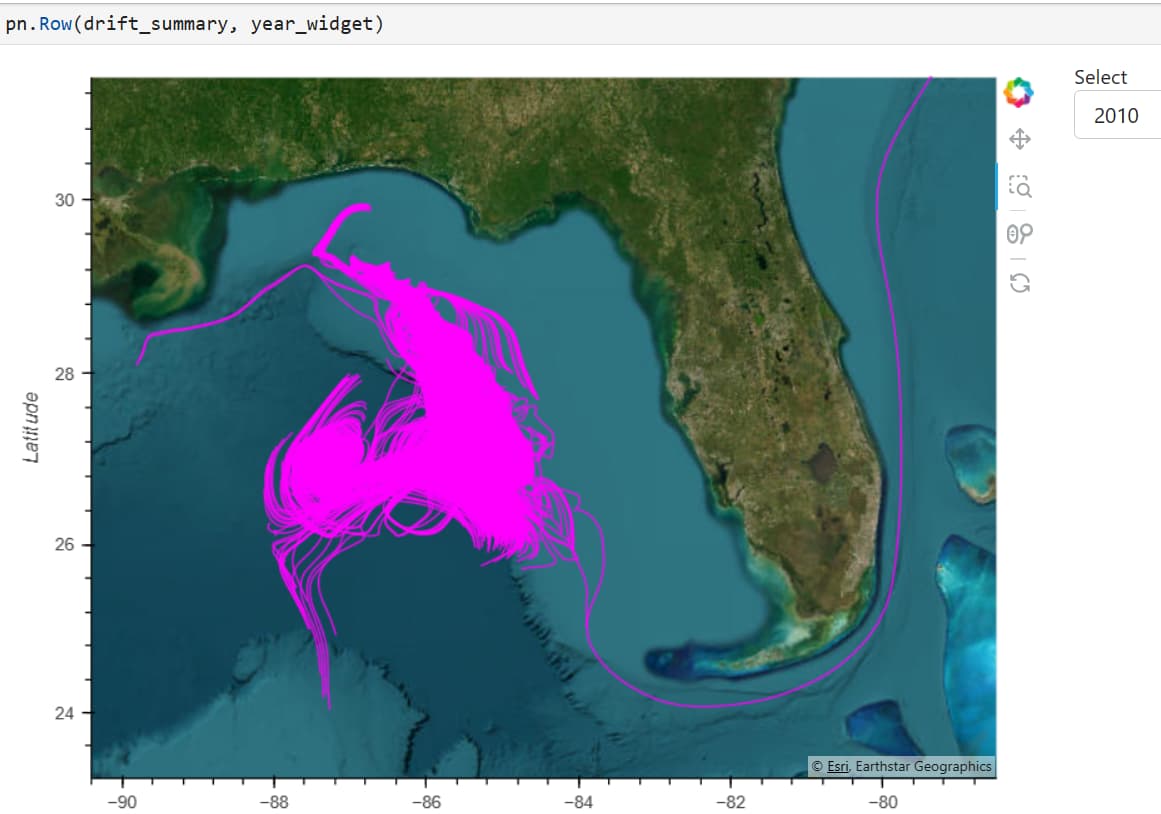
pn.Row(drift_summary, year_widget)
The first plot looks great:
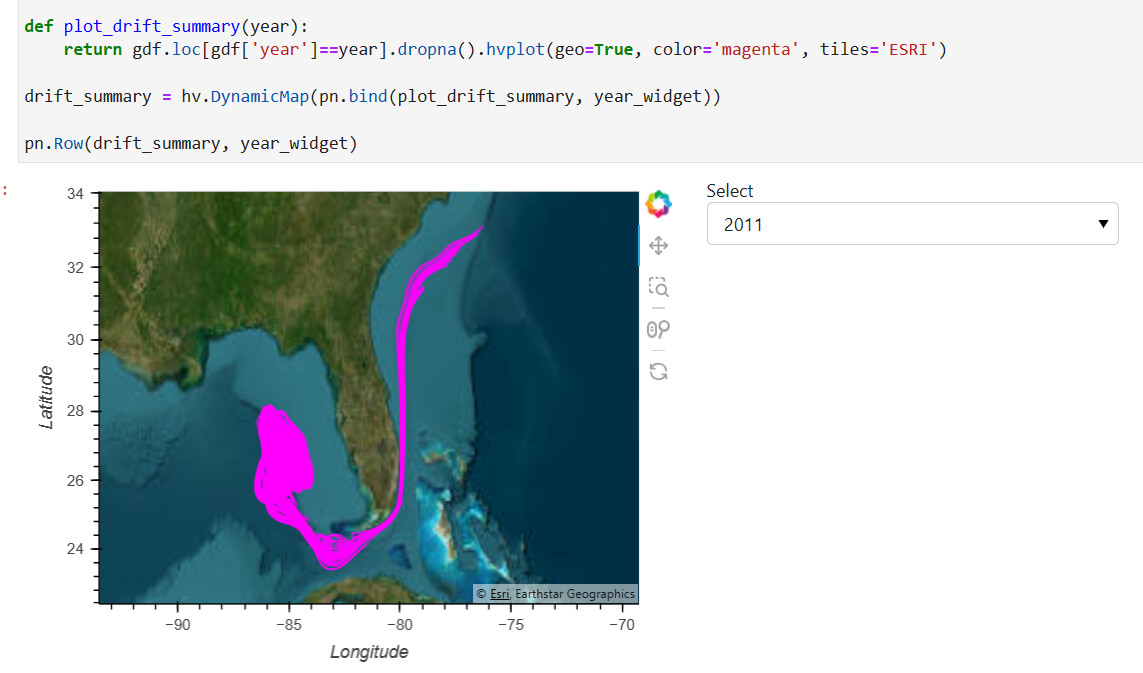
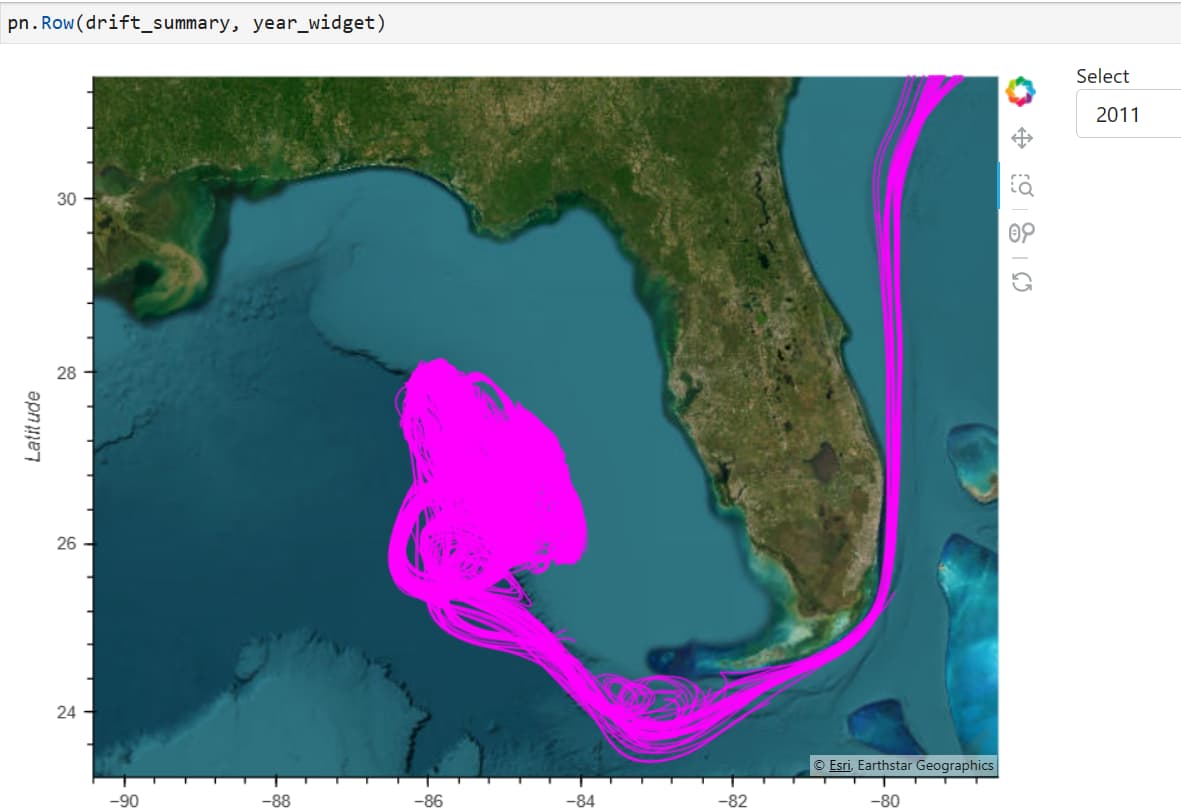
Is there some other parameter I need to set to keep the aspect ratio correct or is this a bug?
It seems that adding responsive=True to the hvplot call seems to do the trick:
import numpy as np
import fsspec
import panel as pn
import geopandas as gpd
import hvplot.pandas
import holoviews as hv

fs = fsspec.filesystem('s3', anon=True, client_kwargs=dict(endpoint_url='https://renc.osn.xsede.org'))

gdf = gpd.read_parquet(fs.open('rsignellbucket2/rsignell/testing/drifters.parq'))

years = list(np.unique(gdf['year']))

year_widget = pn.widgets.Select(name='Select', options=years)

def plot_drift_summary(year):
    return gdf.loc[gdf['year']==year].dropna().hvplot(geo=True, color='magenta', tiles='ESRI', responsive=True)

drift_summary = hv.DynamicMap(pn.bind(plot_drift_summary, year_widget))

pn.Row(drift_summary, year_widget)
results in: