Hi
Is hover_cols in hvplot.heatmap functional? It’s listed in the help, but nothing appears if I set it.
Hi
Is hover_cols in hvplot.heatmap functional? It’s listed in the help, but nothing appears if I set it.
Hi @isomerase
Welcome to the community. Could you post a small, reproducible example? It would make it much easier to help. Thanks.
I’ll try put one together (my current example is with RNA seq data). Basically, I just want extra columns in the tooltip when hovering over a cell.
Here’s an easy way:
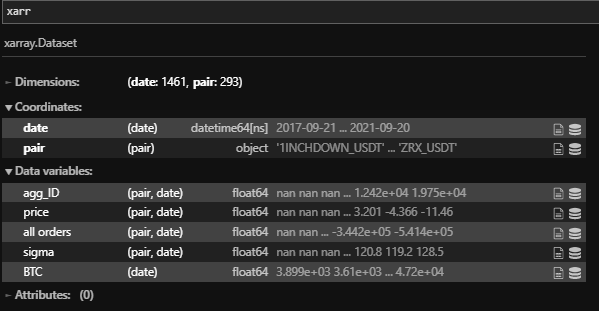
If you put your data into an xarray dataset like this:
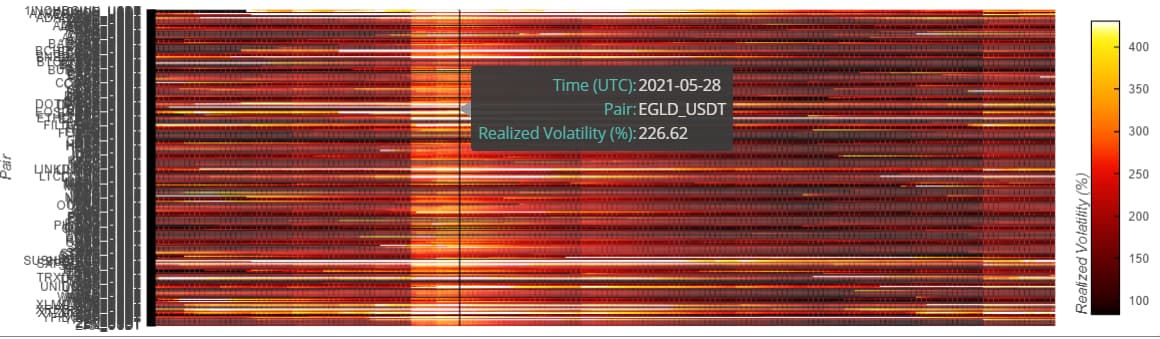
Just call hvplot.heatmap on it, and pass the x,y, and z dimensions. Then, you can pass a HoverTool with tooltips, in which you can specify which metric to display on hover.
xarr.hvplot.heatmap(
    'date','pair','sigma',cmap='fire',
    clabel='Realized Volatility (%)',responsive=True,
    tools=[
             HoverTool(
                tooltips = [
                    ( "Time (UTC)",  "@date{%F}"),
                    ( "Pair", "@pair"),
                    ( "Realized Volatility (%)", "@sigma{0.00 a}"),
                ],
                formatters={
                    '@date':'datetime', # use 'datetime' formatter for 'date' field
                }
            )
    ]+["crosshair"]
).opts(min_height=300,xaxis=None,clipping_colors={'NaN':'black'}).sort(by='pair',reverse=True,)
Output:
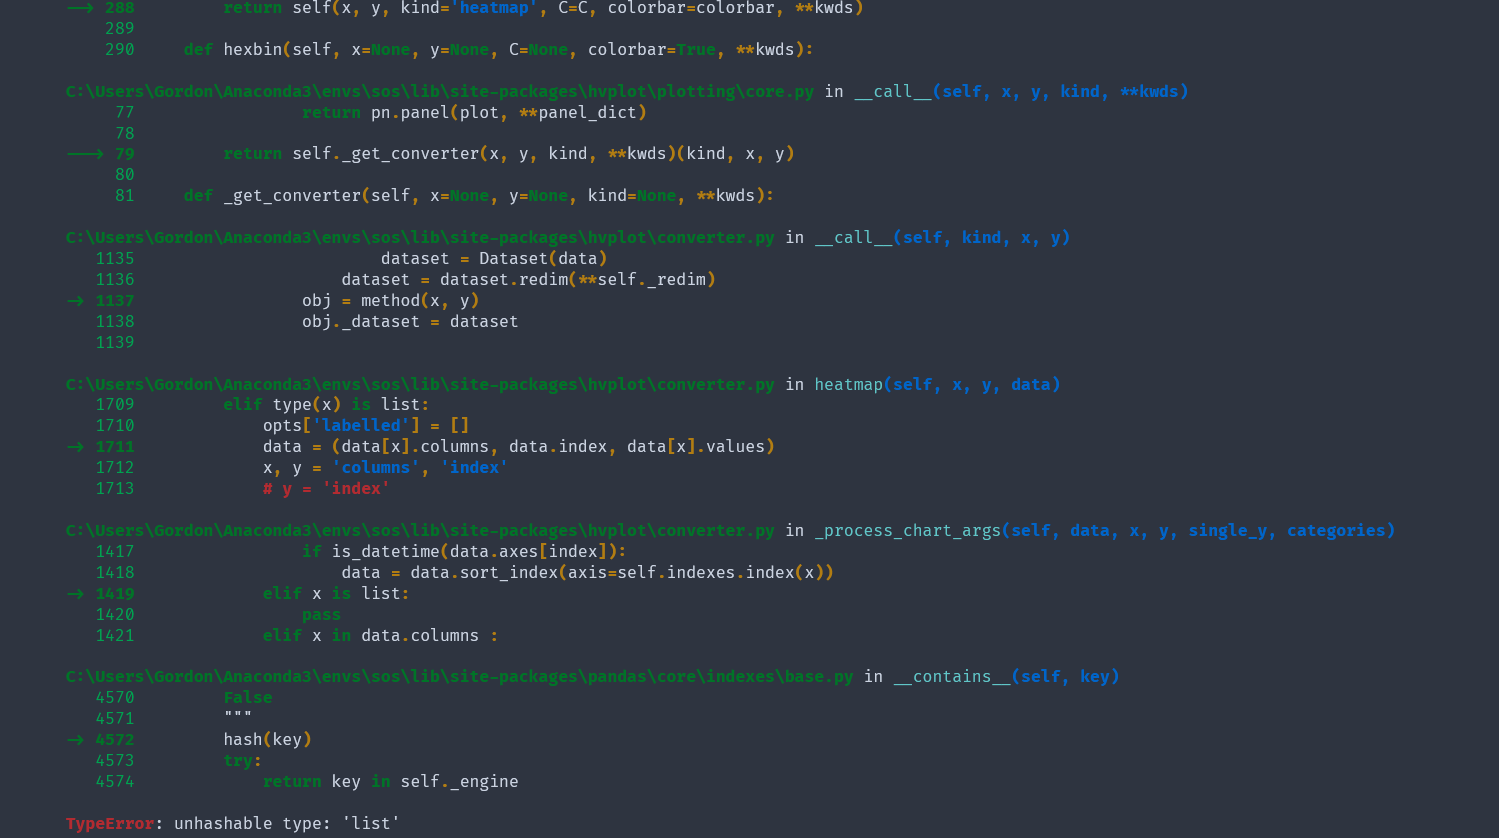
So I figured out part of the problem. I was generating a heatmap based on a .copy() subset of columns without supplying x and y. Doing that gets the graph I want, but stupidly I forgot I was dropping the columns I want to use for hover_cols. But it seems you can’t supply of list of columns you want to use for x from the main pandas dataframe in .heatmap().
Is there a way to generate a heatmap like this:
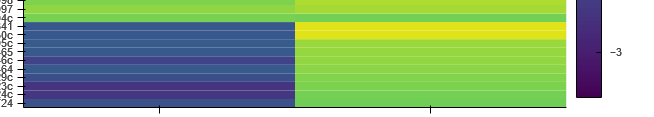
by specifying what columns to use on the x-axis while keeping the whole dataframe, letting me pass other columns to hover_cols?