I’m new to HoloViz and was trying to make an animation with the matplotlib backend showing earthquakes on a world map (gf.land * gf.coastline * gf.borders * points), where points is GeoJSON data from an earthquake API. I am able to make a single plot with the points on the map and that doesn’t have any excess whitespace, but when I generate a HoloMap with 1 map per month, then the layout has all this extra space around it:
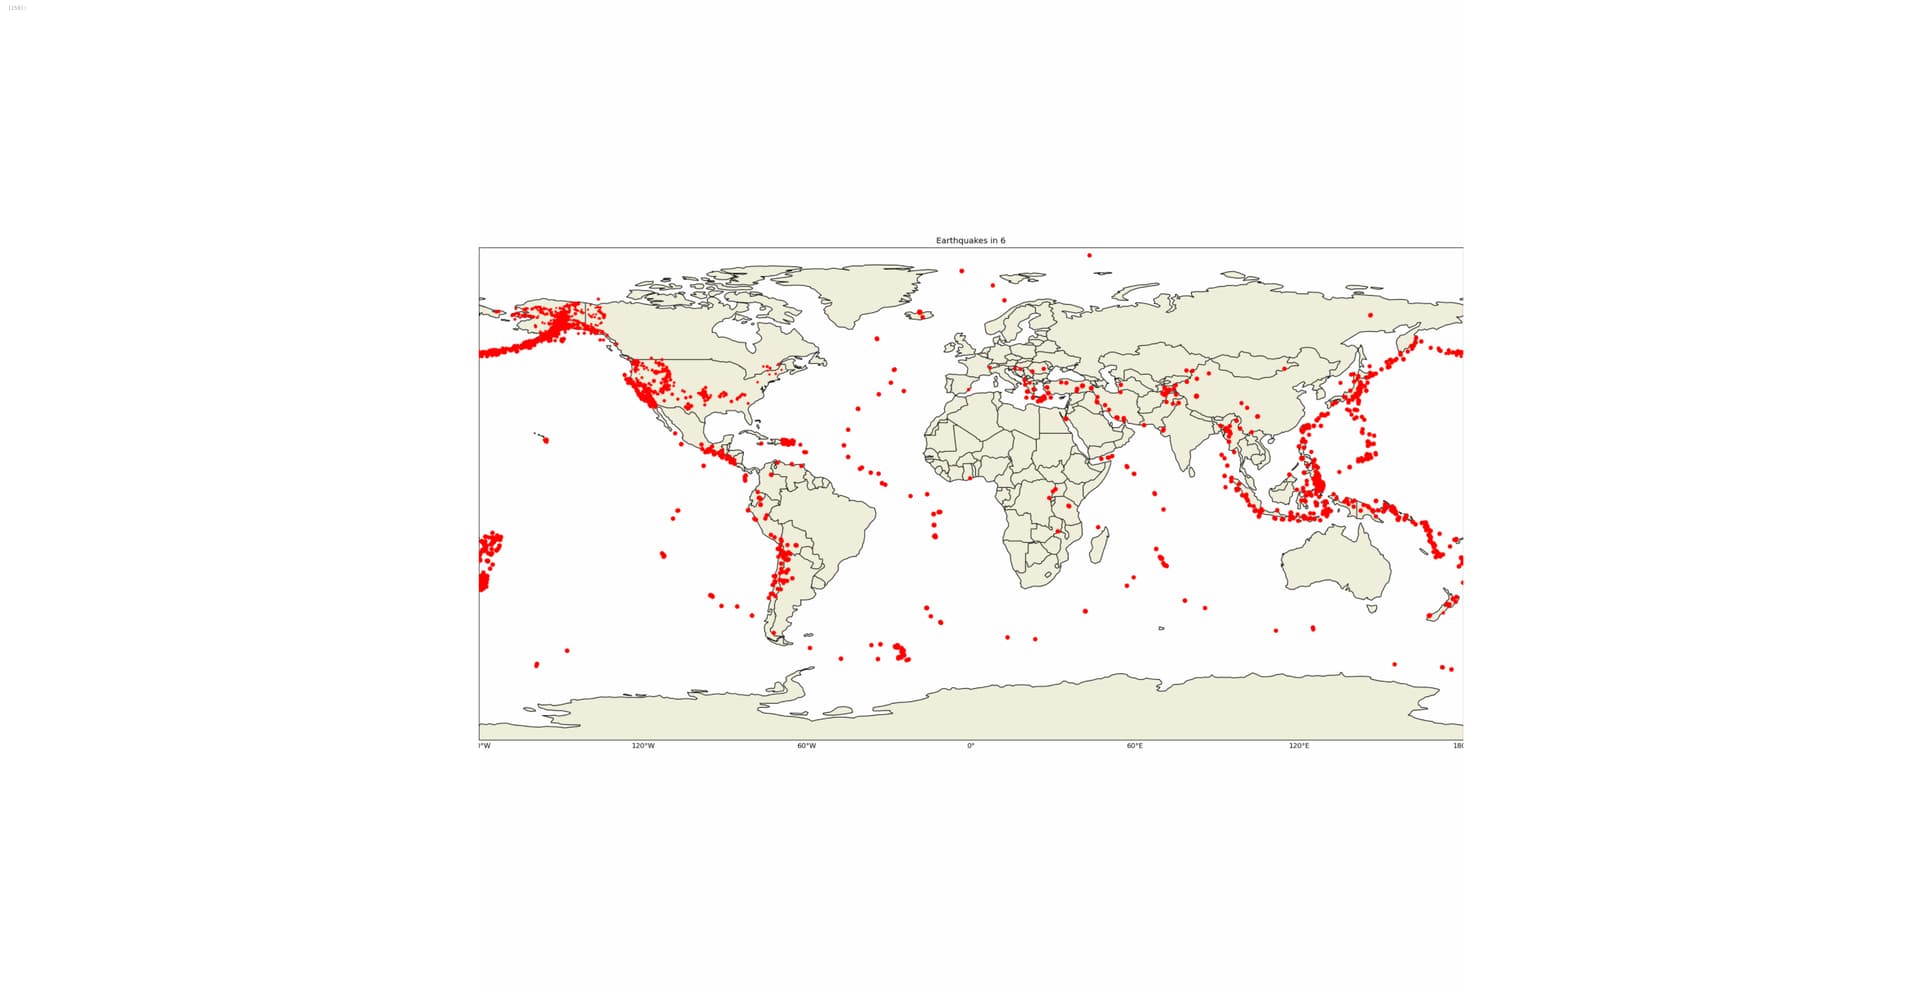
However, if I select a single entry from the HoloMap, it looks fine. How can I fix this? This is what I have so far:
%%opts Overlay [aspect=2]

holomap = hv.HoloMap()
for i in range(1, 13):
    points = gv.Points(
        earthquakes.query(f'month == {i}')[['geometry', 'mag', 'time']],
        kdims=['Longitude', 'Latitude'], vdims=['mag']
    ).opts(color='red', s=hv.dim('mag')*10)
    holomap[i] = (gf.land * gf.coastline * gf.borders * points)\
        .opts(global_extent=True, title=f'Earthquakes in {i}')
holomap.opts(global_extent=True, fig_bounds=(0, 0, 1, 1), fig_inches=5)
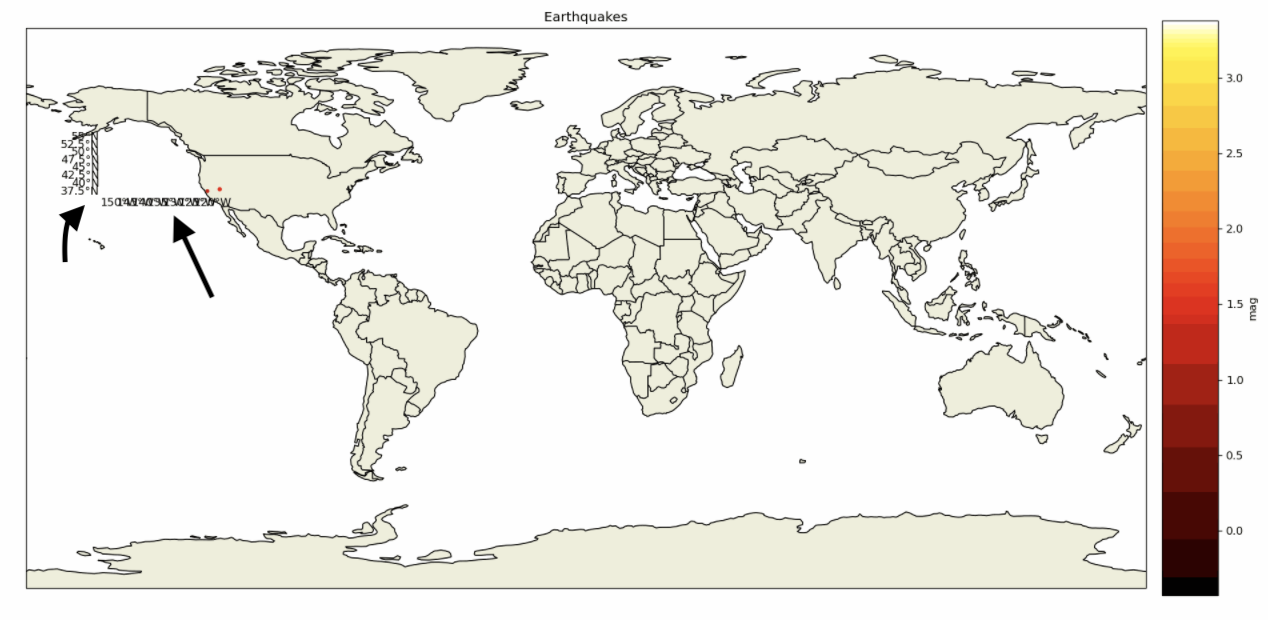
In addition, I wanted to add a colorbar, but that doesn’t seem to play nice with geoviews at all since the axes get messed up – it moves the lat/long labels inside the map currently on the west coast of the US when looking at the full map. (I will post image later since it doesn’t let new users include more than one)