Hi all,
I am trying to create a FilledContours plot with custom colours (specific levels 2 of which need to be highligthed with their own colour). I am finding it hard to find how to accomplish this as I managed to get to
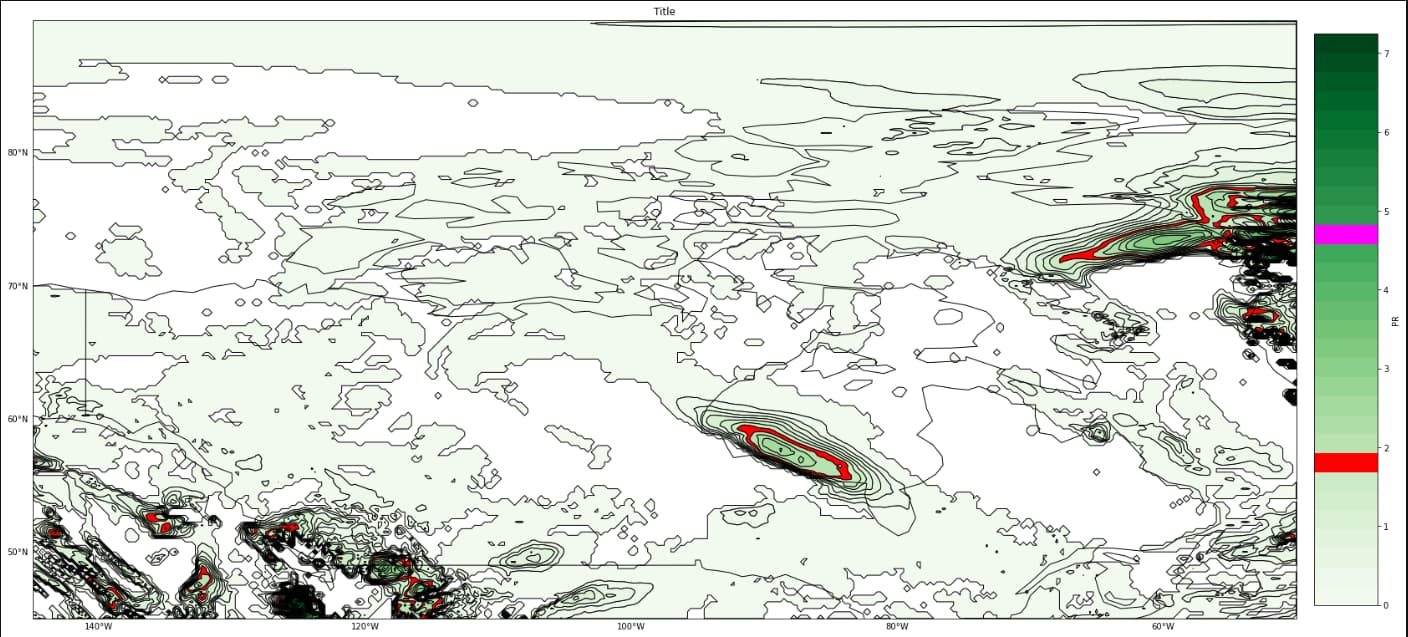
using this code :
gv.extension('matplotlib')
_LEVELS = [0.01, 0.05, 0.1, 0.15, 0.2, 0.3, 0.4, 0.5, 0.75, 1, 1.25, 1.5, 1.75, 2, 2.5, 3, 3.5, 4, 4.5, 5, 5.5, 6, 7, 8, 9, 10, 12, 14, 16, 20, 24]
gv_ds = gv.Dataset(ds.isel(time=0).sel(lon=slice(-145, -50), lat=slice(45, 90)), vdims='PR')
gv_plot = gv.FilledContours(gv_ds, ["lon", "lat"], crs=ds_crs).opts(
    cmap= [
        '#f2faef',
        '#edf8ea',
        '#e9f6e4',
        '#e3f4de',
        '#dbf1d5',
        '#d3eecd',
        '#cbebc4',
        # '#c2e7bb', # 0.5
        '#FF0000', # red
        '#b8e3b1',
        '#aedea7',
        '#a4da9d',
        '#98d594',
        '#8ccf8a',
        '#80ca80',
        '#74c476',
        '#66bd6f',
        '#59b769',
        '#4bb062',
        '#3fa95b',
        # '#37a055', # 5.0
        '#FF00FF',
        '#2f984f',
        '#278f48',
        '#1e8742',
        '#157f3b',
        '#0c7734',
        '#026f2e',
        '#006529',
        '#005a24',
        '#004f20',
        '#00441b',
    ],
    levels=30,
    color_levels=30,
    colorbar=True,
    fig_size=750,
    xlim=(-145, -50),
    ylim=(45, 90),
    title="Title",
)
gv_plot * gvf.coastline * gvf.borders
But I am having a hard time matching the output levels to the colors defined. Some other pain points are how to set properties such as figsize, dpi, line_colour and others as i would like to save this image on disk later. Mr. @ahuang11 made an awesome library/tool in tastymap to create colormaps but I can not figure out how to use it in this instance.