I have the following panel code below, which is pretty close to what I want. After running panel serve... and clicking the “scatter” button in the sidebar, I’m shown an analysis page with:
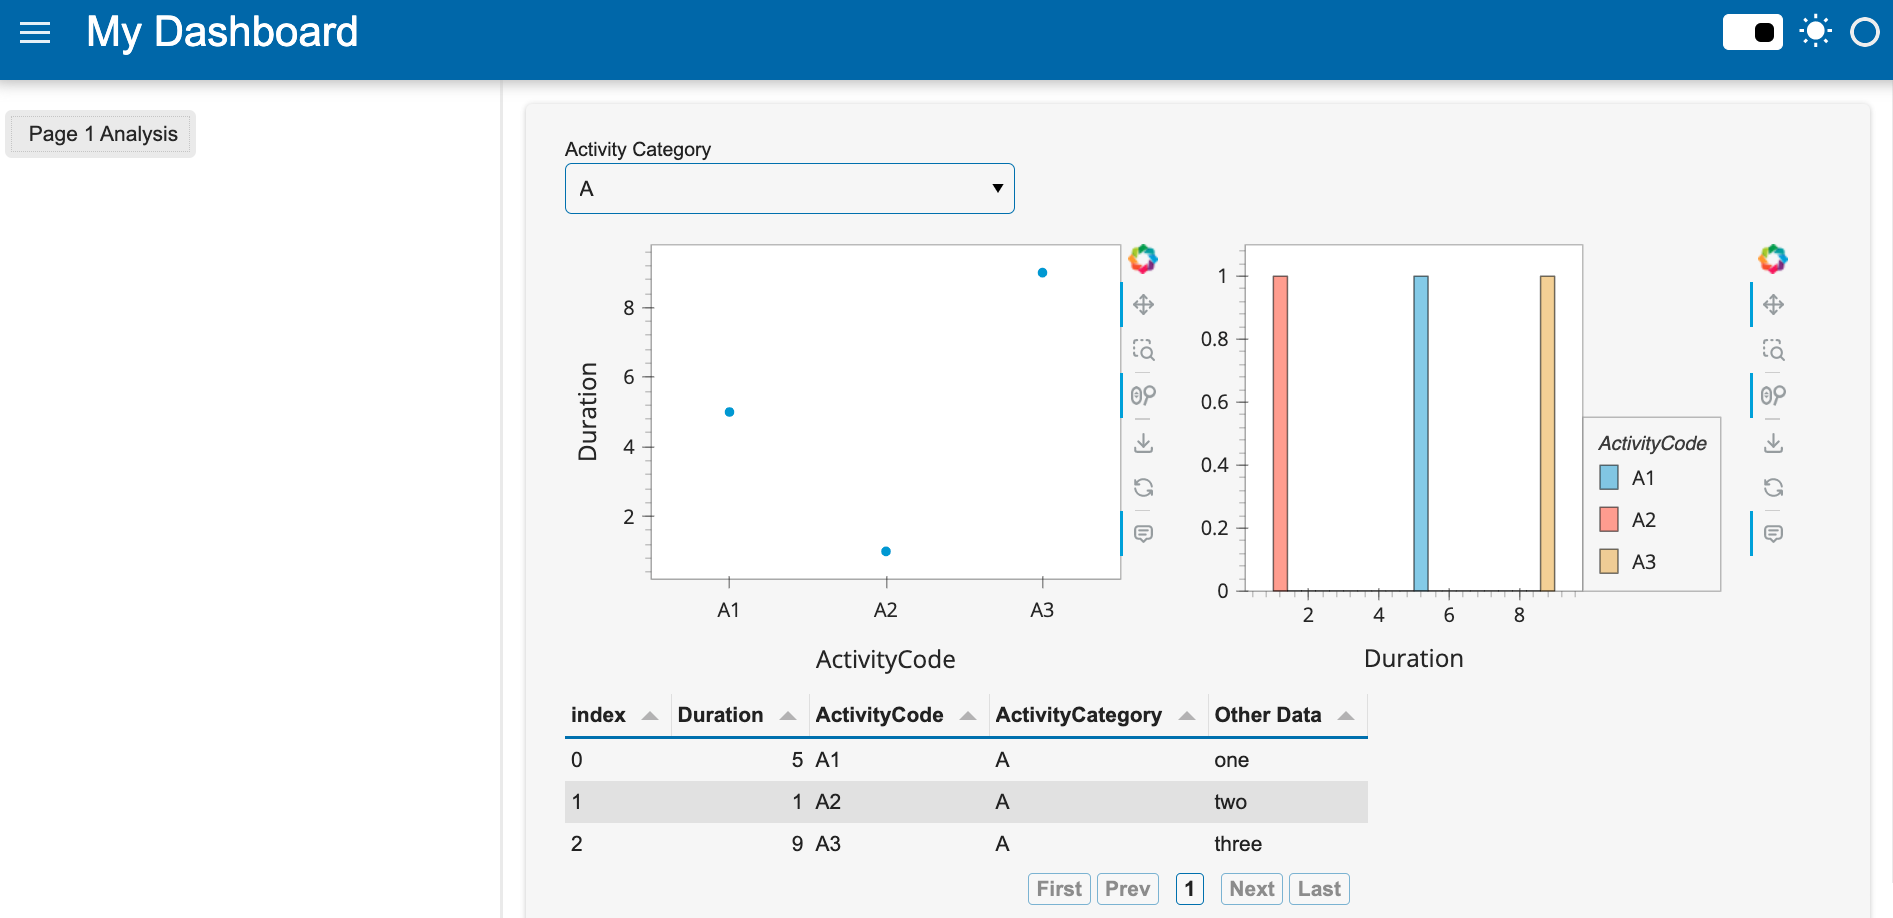
- A selection filter widget
- A scatter plot and histogram side by side (correctly filtered by selection filter)
- A tabulator table below (also correctly filtered by selection filter).
What I want and can’t get working though, is to allow me to select certain points from the scatter plot, and have the histogram and tabulator table also update to filter on those selected points. Below I show:
- First the code that ‘works’ but does not attempt to link selections, and
- Then the code I tried to insert to link the selections, along with the error it caused
Current app.py code:
import pandas as pd
import panel as pn
import holoviews as hv
import hvplot.pandas
import numpy as np

pn.extension()
pn.extension('tabulator')

# load detailed data
durations = np.random.randint(0, 10, size=10)
activity_codes = ['A1', 'A2', 'A3', 'B1', 'B2', 'B3', 'C1', 'C2', 'C3', 'C3']
activity_categories = ['A', 'A', 'A', 'B', 'B', 'B', 'C', 'C', 'C', 'C']
other_data = "one two three four five six seven eight nine ten".split()

df = pd.DataFrame({'Duration': durations,
                   'ActivityCode': activity_codes,
                   'ActivityCategory': activity_categories,
                   'Other Data': other_data})


# Page 1 Widget Controls
ac_categories = ['A', 'B', 'C']
ac_cat_radio_button = pn.widgets.Select(name='Activity Category', options=ac_categories)


# Page 1 Plotting Code - A Scatter Plot and Histogram (will be side by side)
@pn.depends(ac_cat=ac_cat_radio_button)
def scatter_detail_by_ac(ac_cat):
    df_subset = df.loc[df.ActivityCategory==ac_cat]

    print(f"number of records in df_subset to scatter plot: {len(df_subset):,}")
    return df_subset.hvplot.scatter(x='ActivityCode', y='Duration', width=400)

@pn.depends(ac_cat=ac_cat_radio_button)
def hist_by_ac(ac_cat):
    df_subset = df.loc[df.ActivityCategory==ac_cat]

    return df_subset.hvplot.hist('Duration', by='ActivityCode', subplots=False, alpha=0.5, width=400)

# Page 1 Table - Will go below plots above on Page 1
@pn.depends(ac_cat=ac_cat_radio_button)
def table_details(ac_cat):
    return pn.widgets.Tabulator(df.loc[df.ActivityCategory==ac_cat], page_size=5, pagination='remote')


# Page 2 Stuff (Can ignore for this question)
freq2 = pn.widgets.FloatSlider(name="Frequency", start=0, end=10, value=2)
phase2 = pn.widgets.FloatSlider(name="Phase", start=0, end=np.pi)
xs = np.linspace(0,np.pi)
@pn.depends(freq=freq2, phase=phase2)
def cosine(freq, phase):
    return hv.Curve((xs, np.cos(xs*freq+phase))).opts(
        responsive=True, min_height=400)


# App Template & Layout
template = pn.template.FastListTemplate(title='My Dashboard')
page = pn.Column(sizing_mode='stretch_width')
content1 = [pn.Column(ac_cat_radio_button,
                      pn.Row(scatter_detail_by_ac, hist_by_ac),
                      table_details)]
content2 = [pn.Row(freq2, phase2), hv.DynamicMap(cosine)]

link1 = pn.widgets.Button(name='Scatter')
link2 = pn.widgets.Button(name='Another Analysis')

template.sidebar.append(link1)
template.sidebar.append(link2)

template.main.append(page)

# Make Page 1 & Page 2 load on click of corresponding sidebar menu buttons
def load_content1(event):
    template.main[0].objects = content1


def load_content2(event):
    template.main[0].objects = content2

link1.on_click(load_content1)
link2.on_click(load_content2)

# Show app
template.show()
What I’ve tried to link selections, based on other panel code I’ve found implementing this functionality, is to add the following code below the def table_details(... function:
# Attempt to allow selections in scatter plot to filter histogram and tabulator table
selection_linker = hv.selection.link_selections.instance()
scatter_detail_by_ac = selection_linker(scatter_detail_by_ac)
hist_by_ac = selection_linker(hist_by_ac)
table_details = selection_linker(table_details)

scatter_detail_by_ac.opts(tools=['hover'], active_tools=['box_select'])
hist_by_ac.opts(tools=['hover'])
…But then, re-serving the app produces the following error:
AttributeError: 'function' object has no attribute 'clone'
Traceback (most recent call last):
  File "/Users/max.epstein/employee_war_dashboard_pn/panenv/lib/python3.9/site-packages/bokeh/application/handlers/code_runner.py", line 231, in run
    exec(self._code, module.__dict__)
  File "/Users/max.epstein/employee_war_dashboard_pn/so_scratch_app.py", line 49, in <module>
    scatter_detail_by_ac = selection_linker(scatter_detail_by_ac)
  File "/Users/max.epstein/employee_war_dashboard_pn/panenv/lib/python3.9/site-packages/holoviews/selection.py", line 147, in __call__
    return self._selection_transform(hvobj.clone())
AttributeError: 'function' object has no attribute 'clone'
Finally, here’s the versions I’m using, from my requirements.in (which I pip-compile into a requirements.txt / lockfile):
panel==v1.0.0rc6
pandas==1.5.3
holoviews==1.16.0a2
hvplot
pandas-gbq>=0.19.1
Any assistance much appreciated!