Dear All,
is it possibile filtering in tabultor or any widget in panel/hvplot also provide to showing all dataset, currently if we put any filter, data or plot automatically showed to the first default filter, can we showing first all data (show all filter) in the drop down menu filter then user can select a filter they need.
example minimal code with penguins dataset:
import panel as pn
pn.extension('tabulator')
import pandas as pd
df = pd.read_csv('https://datasets.holoviz.org/penguins/v1/penguins.csv')
species_widget = pn.widgets.Select(name="species", options=["Show All",Adelie", "Gentoo", "Chinstrap"])
year_widget = pn.widgets.IntSlider(name="year", start=2007, end=2009)
import hvplot.pandas # Enable interactive
idf = df.interactive()
idf = idf[(idf["species"] == species_widget) & (idf["year"] >= year_widget)]
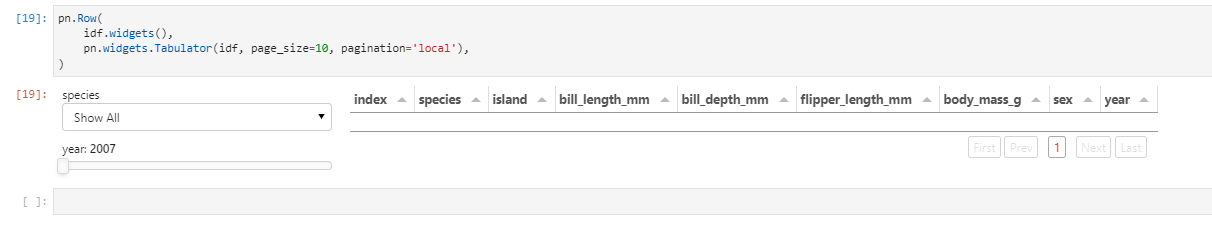
pn.Row(
idf.widgets(),
pn.widgets.Tabulator(idf, page_size=10, pagination='remote'),
)
in the species filter can we have filter like this:“Show ALL”, “Adelie,Gentoo”, “Chinstrap” and what function we needed to enable show all filter work:
thanks