Hi
I’m trying to filter for subsets from a pandas dataframe by column using the select widget. I can make it work in conjunction with a slider, but not by itself. For example, this works
import numpy as np
import pandas as pd
import panel as pn
import holoviews as hv
import hvplot.pandas

pn.extension(sizing_mode='stretch_width')

from bokeh.sampledata.autompg import autompg

mag_slider = pn.widgets.FloatSlider(name='Minimum Magnitude', start=0, end=4000, value=6)

autompgi = autompg.interactive()
select_column  = pn.widgets.Select(name='Column', options=list(autompg.columns))
autompgi[autompgi[select_column] > mag_slider].head()
But this:
autompgi = autompg.interactive()
select_column  = pn.widgets.Select(name='Column', options=list(autompg.columns))
autompgi[[select_column]].head()
or this:
@pn.depends(select_column,watch=True)
def table_col(select_column):
    return autompg[[select_column.value]].head()

pn.Column(
    pn.Row(select_column),
    table_col(select_column)
)
does not. Is there a way to make this work?
So it seems widgets can’t be used to select columns for plots, only within them once they’ve been explicitly specified. Is this correct?
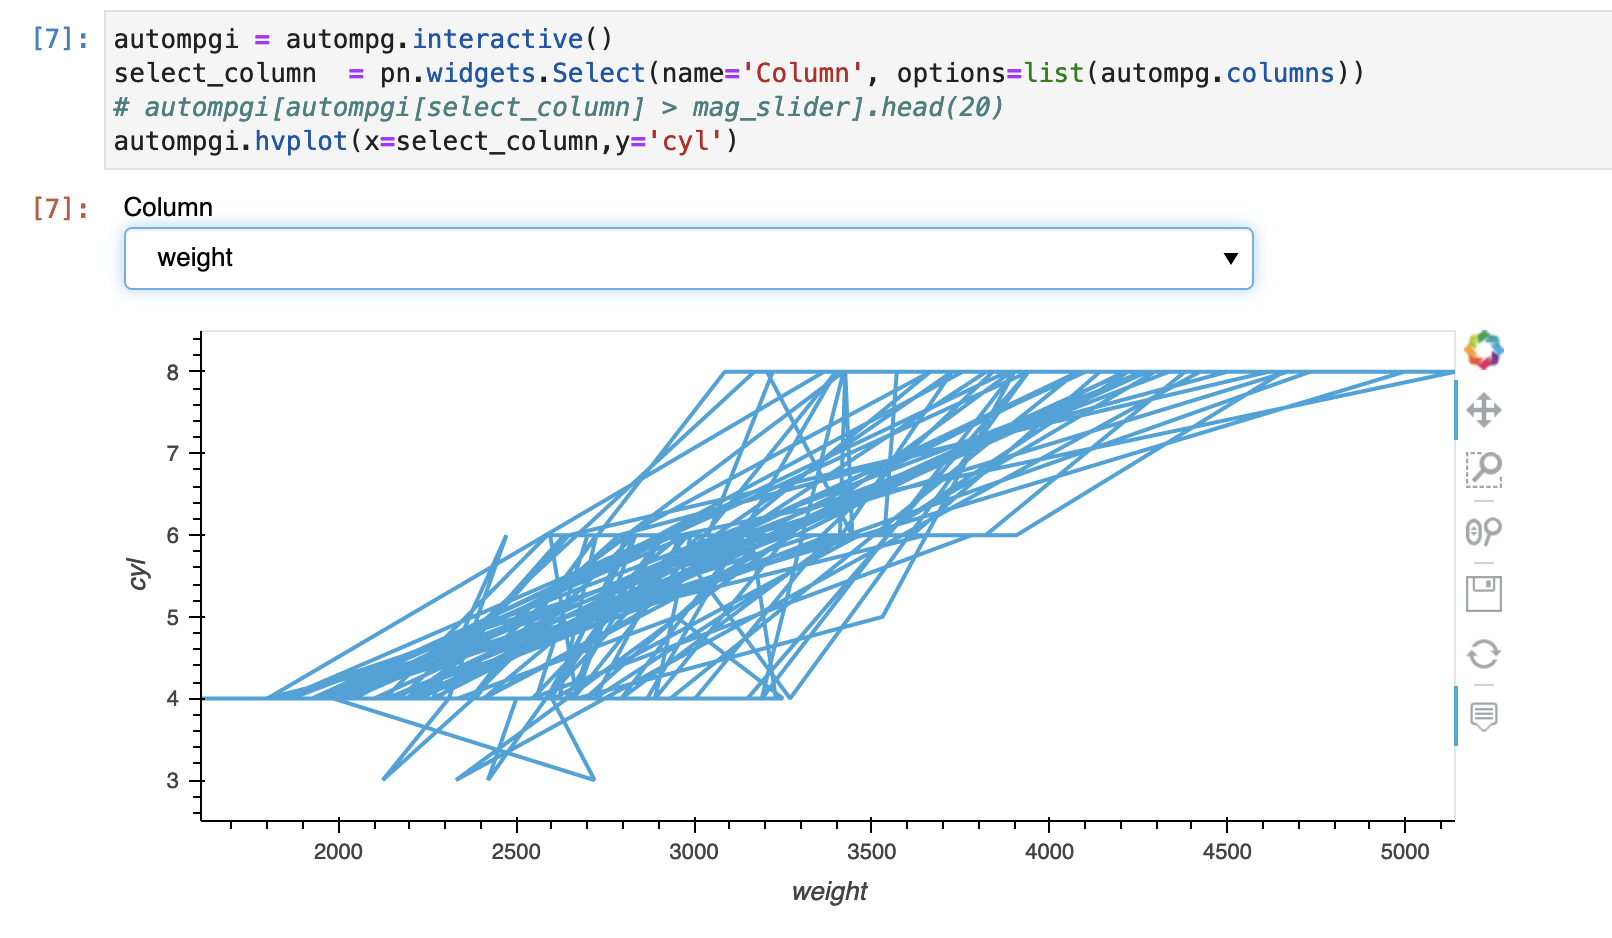
e.g. this doesn’t generate a plot (but I can see the table):
autompgi = autompg.interactive()
select_column  = pn.widgets.Select(name='Column', options=list(autompg.columns))
# autompgi[autompgi[select_column] > mag_slider].head(20)
autompgi.hvplot(x=select_column,y='cyl')
Hi @isomerase !
When I run the last snippet you shared I do get a plot. Isn’t it what you’d expect?
As for the first problems you reported, i.e. not getting a Select widget with autompgi[[select_column]].head(), I can’t really tell if its a bug of .interactive or a feature request.
This would work however:
import hvplot.pandas
import panel as pn

pn.extension(sizing_mode='stretch_width')

from bokeh.sampledata.autompg import autompg

select_column  = pn.widgets.Select(name='Column', options=list(autompg.columns))

@pn.depends(select_column)
def subset(col):
    return autompg[[col]].head()

pn.Column(
    select_column,
    subset
)
Alternatively you could use pn.bind that allows you to avoid having to decorate your subset function:
import hvplot.pandas
import panel as pn

pn.extension(sizing_mode='stretch_width')

from bokeh.sampledata.autompg import autompg

select_column  = pn.widgets.Select(name='Column', options=list(autompg.columns))

def subset(col):
    return autompg[[col]].head()

pn.Column(
    select_column,
    pn.bind(subset, select_column)
)
Hi @maximlt, that’s odd, I just get a blank space where the plot should be.
I’ll try this with my own data, but how is the link between col and select_column happening in the first snippet? What happens when more than one widget is being used?
I confirm that I get the plot as I showed earlier, that’s the setting I used to try your code:
bokeh 2.3.3
param 1.11.1
holoviews 1.14.5
hvplot 0.7.3
panel 0.12.1
numpy 1.20.3
pandas 1.3.1
xarray 0.19.0
I’ll try this with my own data, but how is the link between col and select_column happening in the first snippet?
I could have also declared the decorator in a more explicit, yet equivalent, way:
@pn.depends(col=select_column.param.value)
def subset(col):
    return autompg[[col]].head()
Once decorated and passed to panel within the Column, panel knows that it has to watch the value of the Select widget, and if changed, will run subset again and render the pane with the new output, here a table.
What happens when more than one widget is being used?
It’s exactly the same concept with multiple widgets.
import hvplot.pandas
import panel as pn
from functools import partial

pn.extension(sizing_mode='stretch_width')

from bokeh.sampledata.autompg import autompg

select_column  = pn.widgets.Select(name='Column', options=list(autompg.columns))
mag_slider = pn.widgets.FloatSlider(name='Minimum Magnitude', start=0, end=4000, value=6)

@pn.depends(col=select_column, mag_threshold=mag_slider)
def subset(col, mag_threshold):
    return autompg[autompg[col] > mag_threshold].head()

pn.Column(
    select_column,
    mag_slider,
    subset
)
1 Like
Quick update wrt the plotting, I can see the plot if I close and restart jupyter lab. Discovered this after troubleshooting on two different windows machines and a wsl2 instance. Sometimes the plot still doesn’t show, but I’m not sure what conditions are causing that.
Ok that sounds strange! Is there any error message or warning logged in the browser console?
If you can come up with a reproducible example of this bug it’d be nice of you to open an issue on panel’s issue tracker (before that I’d recommend updating your env with panel’s latest version, to make sure the eventual bug hasn’t been fixed in a recent release).