Hi all,
I’m trying to display some discrete raster data. The values are 0 - 9, and represent the land use classification for that pixel.
For large datasets, I’m using .hvplot.image(rasterize=True, aggregate="mode"). But when I pan / zoom the output and (I assume datashader) recomputes the rasterized output, the colormap will be recomputed based on the values present in the selected region. This causes the color associated with a value 5, say, to switch.
Here’s a dummy example that hopefully demonstrates the same problem:
import xarray as xr
import numpy as np
import hvplot.xarray

x1 = np.random.randint(0, 5, size=(500, 1000))
x2 = np.random.randint(5, 10, size=(500, 1000))

ds = xr.DataArray(np.concatenate([x1, x2]), dims=['x', 'y'],
                  coords={"x": np.arange(1000), "y": np.arange(1000)})

ds.hvplot.image(cmap="inferno", rasterize=True, aggregator="mode")
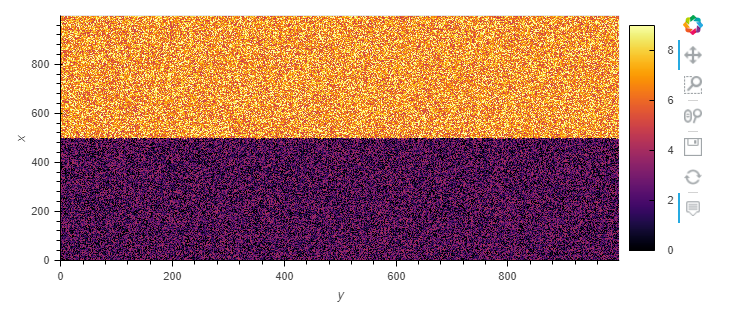
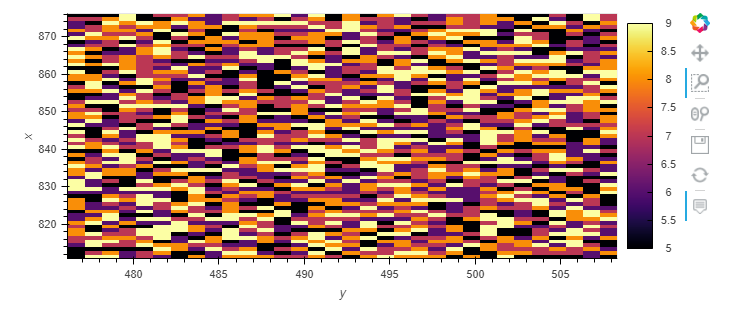
The colorbar ranges from 0 - 9. But when I zoom in on just the top half (so the lowest value is now 5, not 0), the colors are reassigned
(image redacted since discourse only lets me have one per post. I’ll move it to a comment.)
So now a value of 5 is given the color that was previously 0.
Is there a way to “fix” the range of the colormap, so that the range is always 0 - 9? I think I want something like the span argument to tf.shade mentioned at Pipeline — Datashader 0.12.0 documentation, but I don’t see a way to pass that through .hvplot.image.