import xarray as xr
import hvplot.xarray
ds = xr.tutorial.open_dataset('air_temperature')
ds['lon'] = ds['lon'][::-1]
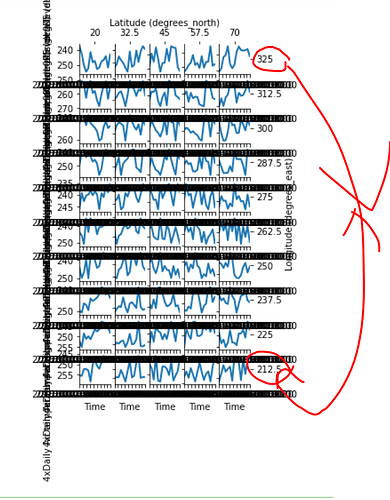
ds.coarsen(lat=5, lon=5, boundary='trim').mean().isel(time=slice(0, 150, 10)).hvplot(row='lat', col='lon', x='time', y='air')
flip_yaxis inverts the individual y_axes, but how do I go from 212.5 on top to 325 on bottom?
