Formating Text in a python panel

I am creating a dashboard for some metrics using the python panel library in Jupyter Labs. I am using python 3.8.3, pandas 1.0.5 and panel 0.9.7.

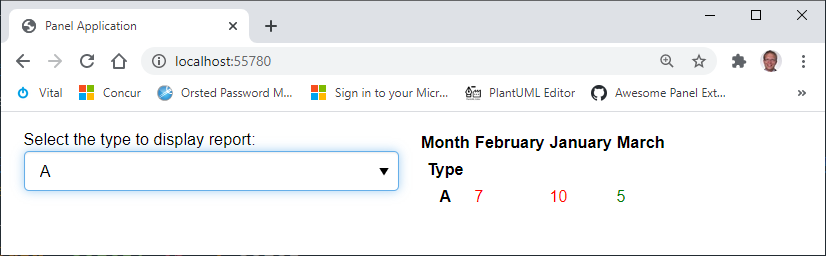
I am displaying a panel depending on a value chosen in a panel widget. I would like to change the font color of the numbers in the panel depending on its value, that is, any number below a threshold should be green and any number above should be red.

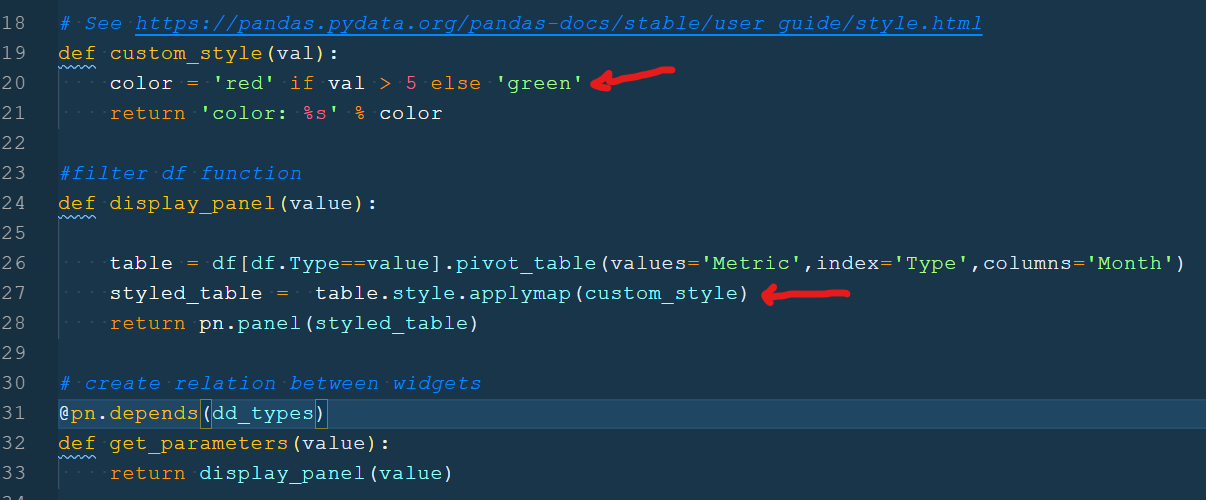
The below code is an example of the code I am using. In this example I would like to change the font color to red in the displaying panel for any number above 5 and change to green any number below 5.

Any suggestions will be highly appreciated

#imports
import pandas as pd 
import panel as pn
pn.extension()
  
# initialize list of lists 
data = [['A','January',10],['A','February',7],['A','March',5],['B','January',4],['B','February',8],['B','March',12] ] 
  
# Create the pandas DataFrame 
df = pd.DataFrame(data, columns = ['Type', 'Month','Metric']) 

#lists creation
type_list=['A','B']

#widget creation
dd_types = pn.widgets.Select(name='Select the type to display report:', options=type_list)

#filter df function
def display_panel(value):
    
    table = df[df.Type==value].pivot_table(values='Metric',index='Type',columns='Month')
    return pn.panel(table)

# create relation between widgets
@pn.depends(dd_types)
def get_parameters(value):
    return display_panel(value)


# arrange and correlate widgets and functions
report_area = pn.Row(dd_types, get_parameters)
report_area.show()

Hi @guidozamora

Please look at this page: https://panel.holoviz.org/user_guide/Customization.html
The inline style options might already give you what you need.

For more complex styling you could use a html pane, which is documented here:
https://panel.holoviz.org/reference/panes/HTML.html#panes-gallery-html

Thanks a lot @Leonidas I will look into the documentation!

1 Like

Hi @guidozamora

Since what you are looking to do is styling a Pandas DataFrame you could look into the Pandas Styling Documentation.

You can use that together with a Panel pane.

#imports
import pandas as pd
import panel as pn
pn.extension()

# initialize list of lists
data = [['A','January',10],['A','February',7],['A','March',5],['B','January',4],['B','February',8],['B','March',12] ]

# Create the pandas DataFrame
df = pd.DataFrame(data, columns = ['Type', 'Month','Metric'])

#lists creation
type_list=['A','B']

#widget creation
dd_types = pn.widgets.Select(name='Select the type to display report:', options=type_list)

# See https://pandas.pydata.org/pandas-docs/stable/user_guide/style.html
def custom_style(val):
    color = 'red' if val > 5 else 'green'
    return 'color: %s' % color

#filter df function
def display_panel(value):

    table = df[df.Type==value].pivot_table(values='Metric',index='Type',columns='Month')
    styled_table =  table.style.applymap(custom_style)
    return pn.panel(styled_table)

# create relation between widgets
@pn.depends(dd_types)
def get_parameters(value):
    return display_panel(value)


# arrange and correlate widgets and functions
report_area = pn.Row(dd_types, get_parameters)
report_area.show()

@Marc,

Thanks a lot for your response. I was able to set the df with the format I wanted and it worked perfectly when I execute the code directly. But when I put it into a function and return the styled dataframe I keep the color but lose some other formatting (spacing, alignment, the shadows every row, the line below the the column names)

Example of current code

#imports
import pandas as pd
import panel as pn
pn.extension()

initialize list of lists

data = [[‘A’,‘January’,900],[‘A’,‘February’,7675],[‘A’,‘March’,50],[‘B’,‘January’,4345],[‘B’,‘February’,432],[‘B’,‘March’,1200] ]

def custom_style(val):
color = ‘red’ if val > 500 else ‘black’
return ‘color: %s’ % color

Create the pandas DataFrame

df = pd.DataFrame(data, columns = [‘Type’, ‘Month’,‘Metric’])

#lists creation
type_list=[‘A’,‘B’]

#widget creation
dd_types = pn.widgets.Select(name=‘Select the type to display report:’, options=type_list)

#filter df function
def display_panel(value):

table = df[df.Type==value].pivot_table(values='Metric',index='Type',columns='Month')
styled_table = table.style.applymap(custom_style).format('{:,.0f}')
return pn.panel(styled_table)

create relation between widgets

@pn.depends(dd_types)
def get_parameters(value):
return display_panel(value)

arrange and correlate widgets and functions

report_area = pn.Row(dd_types, get_parameters)
report_area.show()

@Marc,

Actually looking at the picture you posted, it looks like you also lose those formatting…