Hi @guidozamora
Since what you are looking to do is styling a Pandas DataFrame you could look into the Pandas Styling Documentation.
You can use that together with a Panel pane.
#imports
import pandas as pd
import panel as pn
pn.extension()
# initialize list of lists
data = [['A','January',10],['A','February',7],['A','March',5],['B','January',4],['B','February',8],['B','March',12] ]
# Create the pandas DataFrame
df = pd.DataFrame(data, columns = ['Type', 'Month','Metric'])
#lists creation
type_list=['A','B']
#widget creation
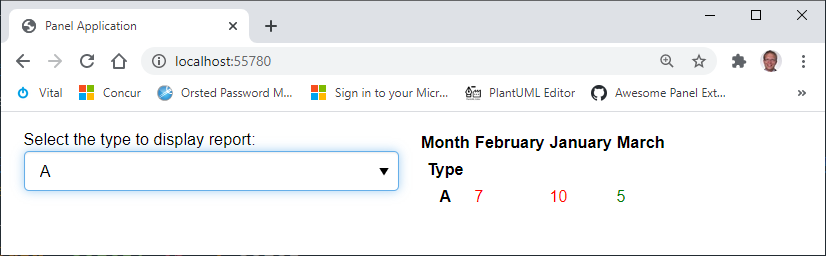
dd_types = pn.widgets.Select(name='Select the type to display report:', options=type_list)
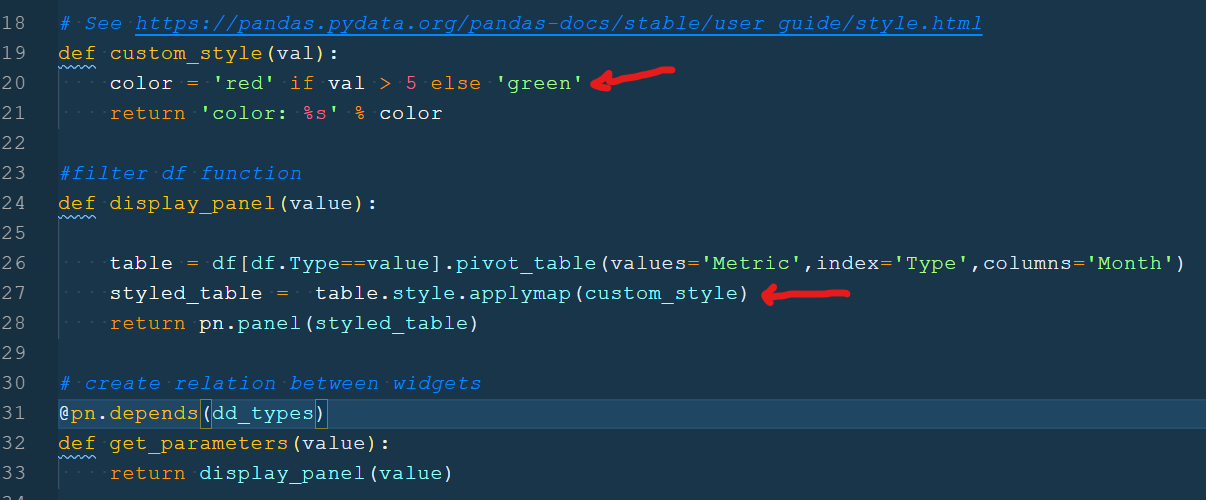
# See https://pandas.pydata.org/pandas-docs/stable/user_guide/style.html
def custom_style(val):
color = 'red' if val > 5 else 'green'
return 'color: %s' % color
#filter df function
def display_panel(value):
table = df[df.Type==value].pivot_table(values='Metric',index='Type',columns='Month')
styled_table = table.style.applymap(custom_style)
return pn.panel(styled_table)
# create relation between widgets
@pn.depends(dd_types)
def get_parameters(value):
return display_panel(value)
# arrange and correlate widgets and functions
report_area = pn.Row(dd_types, get_parameters)
report_area.show()