Thanks for your answer.
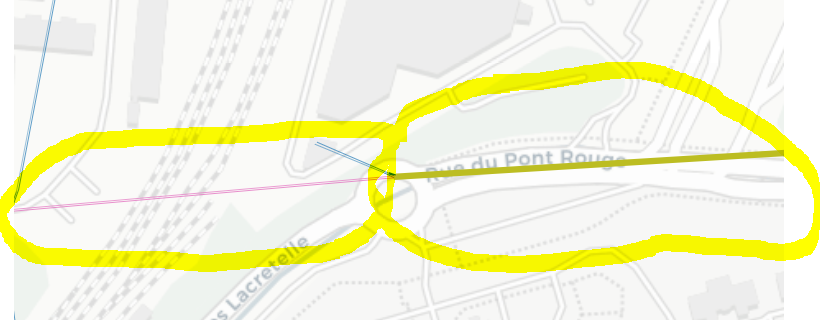
Here is a screenshot of what I mean by “not accurate”:
On this screenshot is a part of the lines plotted by hvplot. There are on this screenshot 2 parallel pink lines, 2 parallel olive lines, some blue lines and the position of these lines is expected and correct.
What is not correct is the color and the width of the pink lines, which should be the same as the olive lines.
Both of theses LineString displayed here are supposed to be:
1/ the same color, as the color is defined by by='color_col', which is the same on both of the lines
2/ the same line width as the line width is taken as well from the dataframe and has been checked a few times already.
I do have a warning that I did not pay attention to:
BokehUserWarning: ColumnDataSource's columns must be of the same length. Current lengths: ('Edge_Name', 1736), ('Massflow', 1736), ('cluster', 1736), ('diameter', 1736), ('lat_in', 1736), ('lat_out', 1736), ('length', 1736), ('line_color', 1744), ('line_width', 1744), ('lon_in', 1736), ('lon_out', 1736), ('plot_d', 1736), ('xs', 1736), ('ys', 1736)
On this warning, it should be noted that line_width and line_color are parameters of the plot, and not actual columns of the initial DataFrame. len(df) is equal to 1745, but I can’t fin invalid datas with df.isna for example.
I might try to do the plos on holoviews/geoviews to compare later in the week.