Hello John!
Here’s a basic geoviews example we can tinker with to try and get you troubleshooting:
import holoviews as hv
import geoviews as gv
import geoviews.tile_sources as gts
import pandas as pd
import geopandas
import panel as pn

hv.extension('bokeh')

df = pd.DataFrame(
                    {'City': ['Buenos Aires', 'Brasilia', 'Santiago', 'Bogota', 'Caracas','Tacna','Pucallpa','Lima','Langa'],
                    'Country': ['Argentina', 'Brazil', 'Chile', 'Colombia', 'Venezuela','Peru','Peru','Peru','Peru'],
                    'Latitude': [-34.58, -15.78, -33.45, 4.60, 10.48, -18.006,-8.392,-12.046,-12.125],
                    'Longitude': [-58.66, -47.91, -70.66, -74.08, -66.86,-70.246,-74.582,-77.0427,-76.4211]})

gdf = geopandas.GeoDataFrame(df, geometry=geopandas.points_from_xy(df.Longitude, df.Latitude),crs="EPSG:3857")

gv_table = hv.Table(gdf)
checkbutton_group = pn.widgets.CheckButtonGroup(name='Check Button Group', value=['Points'], options=['Labels', 'Points'])

@pn.depends(vis_list=checkbutton_group.param.value,watch=True)
def full_plot(vis_list):
    tiles=gts.OSM.options(level='glyph')
    base_plot = [tiles,]
    points = gv.Points(gv_table,kdims=['Longitude','Latitude'],vdims=['City','Country'])
    labels = gv.Labels(points,vdims=['City'])

    if 'Points' in vis_list:
        base_plot.append(points.opts(size=10,nonselection_alpha=0.2,color='red'))
    if 'Labels' in vis_list:
        base_plot.append(labels)
    return hv.Overlay(base_plot)

plot = hv.DynamicMap(full_plot)

layout = pn.Row(pn.Column(checkbutton_group,plot.opts(width=600,height=600)))
layout
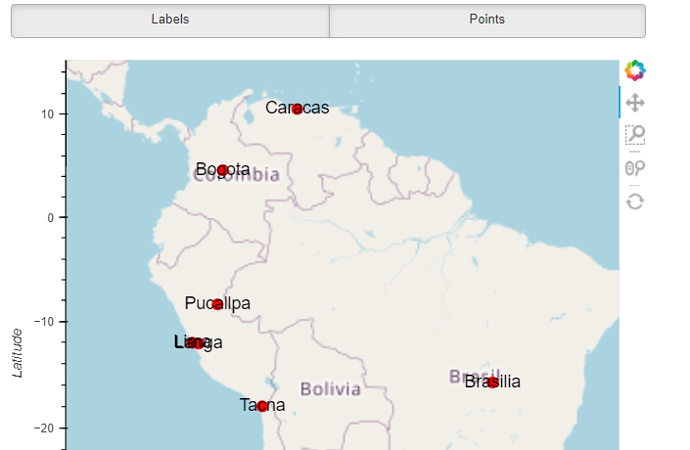
This should let you toggle on/off the point labels via the widget at the top:
… is this close to what you were aiming for? Instead of the widget you could trigger the label visibility of other things too, like selection streams, etc…
