GeoViews and Holoviews - Is it possible to make the muted data points unselectable, like Bokeh does?

I have several interactive legends for some points in a map developed using GeoViews and also for some point plots using Holoviews, but I found after I muted some of the points by clicking the corresponding legends, the points can still be selected using box-select and other select tools. This can be distracted if I just want to temporarily focus on the un-muted points. While, in Bokeh, after the points are muted, they will never be selected.

Thanks!

@happybearxp Could you provide an example of the behavior in bokeh and in HoloViews? HoloViews just renders using bokeh so the mechanism behind muting is exactly the same so I really can’t account for any differences here.

I think Bokeh has two options for “legend.click_policy”, “hide” and “mute”. If it is “hide”, the hided data points will not be selected. Not sure if Holoviews and GeoViews have a similar option for this?

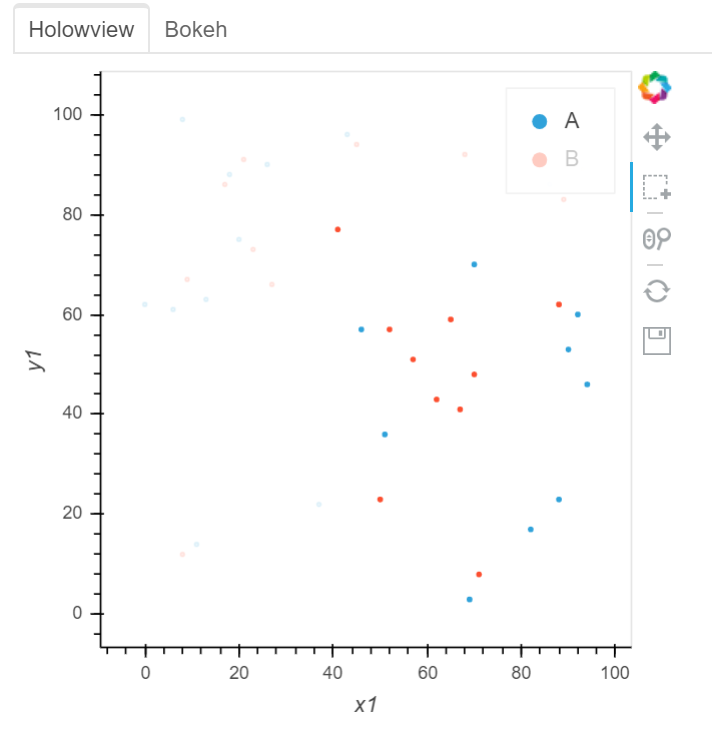
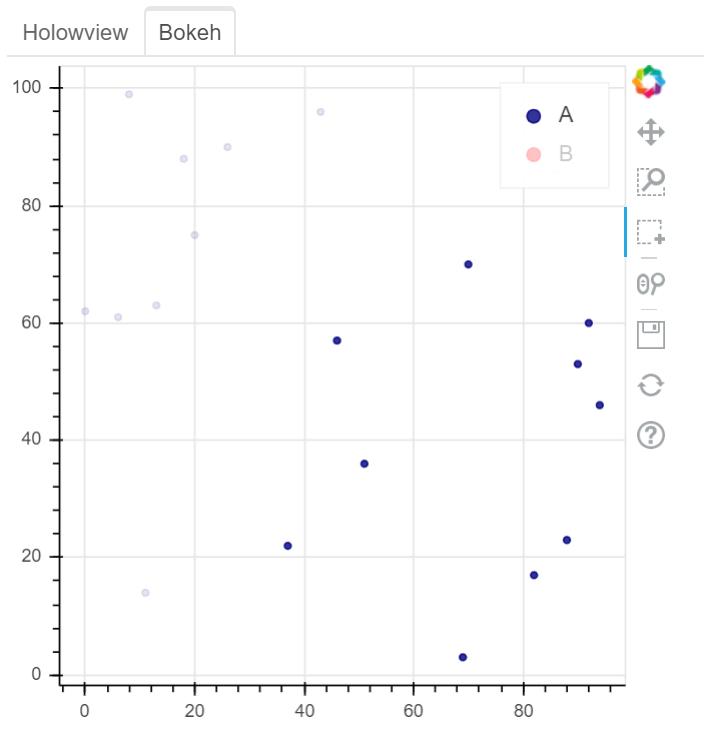
See two screenshots below. Legends “B” are muted in both two plots, and only data points of “A” are intended to be selected using Box Select tool. In Holoviews plot, the red points from Legend “B” are selected, while only Legend “A” points are selected in Bokeh plot:

Here is my example code:

data_plot_opts = dict(muted_alpha = 0.,
default_tools=[‘pan’,‘box_select’,‘reset’,‘wheel_zoom’, ‘save’],
active_tools =[‘box_select’])

y1=random.sample(range(100), 20)
x1=random.sample(range(100), 20)
x2=random.sample(range(100), 20)
y2=random.sample(range(100), 20)

Holoview:

df_trial1=pd.DataFrame({‘y1’:y1, ‘x1’:x1})
df_trial2=pd.DataFrame({‘y2’:y2, ‘x2’:x2})

data_profile_1 = hv.Points(df_trial1, kdims=[‘x1’, ‘y1’], label=“A”).opts(**data_plot_opts)
data_profile_2 = hv.Points(df_trial2, kdims=[‘x2’, ‘y2’], label=“B”).opts(**data_plot_opts)
data_profile_Holoview = pn.Column((data_profile_1*data_profile_2).opts(width=400, height=400), sizing_mode=‘stretch_width’)

Bokeh:

p = figure(plot_width=400, plot_height=400)
p.circle(x1, y1, color=“navy”, alpha=0.8, legend_label=‘A’)
p.circle(x2, y2, color=“red”, alpha=0.8, legend_label=‘B’)
p.add_tools(BoxSelectTool())
p.legend.location = “top_right”
p.legend.click_policy=“hide”

data_profile_tab = pn.Tabs((‘Holowview’, data_profile_Holoview), (‘Bokeh’, p), tabs_location=‘above’)

all_sections_view = pn.Row(data_profile_tab, width_policy=‘max’, height_policy=‘max’)

layout = all_sections_view.get_root()

curdoc().add_root(layout)
curdoc().title = “Legend_Mute”

Here is the Bokeh plot:

That’s perfect thank you! We should definitely expose that option on the legend in some way, e.g. with a legend_opts option. For now you could use a hook:


data_plot_opts = dict(muted_alpha = 0., default_tools=['pan','box_select','reset','wheel_zoom', 'save'], active_tools =['box_select'])

y1=random.sample(range(100), 20)
x1=random.sample(range(100), 20)
x2=random.sample(range(100), 20)
y2=random.sample(range(100), 20)

df_trial1=pd.DataFrame({'y1':y1, 'x1':x1})
df_trial2=pd.DataFrame({'y2':y2, 'x2':x2})

def click_policy(plot, element):
    plot.state.legend.click_policy = 'hide'

data_profile_1 = hv.Points(df_trial1, kdims=['x1', 'y1'], label="A").opts(**data_plot_opts)
data_profile_2 = hv.Points(df_trial2, kdims=['x2', 'y2'], label="B").opts(**data_plot_opts)
pn.Column((data_profile_1*data_profile_2).opts(width=400, height=400, hooks=[click_policy]), sizing_mode='stretch_width')
1 Like

Thanks, Philipp. It works perfectly!

philippjfr, thank you for the hook solution. It indeed works great with holoviews. Do you think it’d possible to modify the function in order to have updated axes range after hiding a glyph. So, for example, in plot attached above, after hiding trace for ‘B’ , X axis should have range (~30, 100) and Y axis (0, 80). This’d be very handy

@tmikolajczyk It’s a bit verbose but here’s an approach with a bokeh CustomJS callback:

import random

data_plot_opts = dict(muted_alpha = 0., default_tools=['pan','box_select','reset','wheel_zoom', 'save'], active_tools =['box_select'])

y1=random.sample(range(100), 20)
x1=random.sample(range(100), 20)
x2=random.sample(range(100), 20)
y2=random.sample(range(100), 20)

df_trial1=pd.DataFrame({'y1':y1, 'x1':x1})
df_trial2=pd.DataFrame({'y2':y2, 'x2':x2})

from bokeh.models import CustomJS
def click_policy(plot, element):
    p = plot.state
    p.legend.click_policy = 'hide'
    cb = CustomJS(code="""
    if (!r1.visible) {
      var [low, high] = r2_range
    } else if (!r2.visible) {
        var [low, high] = r1_range
    } else {
      var [low, high] = total
    }
    y_range.start = low
    y_range.end = high
    """,
    args={
        'r1': p.renderers[0],
        'r2': p.renderers[1],
        'y_range': p.y_range,
        'total': [p.y_range.start, p.y_range.end],
        'r1_range': data_profile_1.range(1),
        'r2_range': data_profile_2.range(1)
    })
    p.renderers[0].js_on_change('visible', cb)
    p.renderers[1].js_on_change('visible', cb)
    

data_profile_1 = hv.Points(df_trial1, kdims=['x1', 'y1'], label="A").opts(**data_plot_opts)
data_profile_2 = hv.Points(df_trial2, kdims=['x2', 'y2'], label="B").opts(**data_plot_opts)

pn.Column((data_profile_1*data_profile_2).opts(width=400, height=400, hooks=[click_policy]), sizing_mode='stretch_width')
1 Like

Thanks again for the help!

@philippjfr I modified your function in order to have the solution for multi traces plot (working example below). I works great. I hope it can be helpful for someone. However there are some big issues with NaN’s (see below).

capture1

import pandas as pd
import numpy as np
import panel as pn
import random
import holoviews as hv
import random
from itertools import compress
from bokeh.models import CustomJS

hv.extension('bokeh')

def hook(plot, element):
    p = plot.state
    p.legend.click_policy = 'hide'

    ranges_in = []
    visible = []
    for layer in range(len(plot.current_frame)):
        ranges_in.append(list((list(plot.current_frame.data.values())[layer].data.y.min(),
                               list(plot.current_frame.data.values())[layer].data.y.max())))
        visible.append(p.renderers[layer].visible)

    ranges_out = list(compress(ranges_in, visible))
    ranges_out = np.array(ranges_out)
    ranges_out[np.isnan(ranges_out)] = np.nanmin(ranges_out)
    ranges_out = list((min([x[0] for x in ranges_out]), max([x[1] for x in ranges_out])))

    ranges_in = np.array(ranges_in)

    callback = CustomJS(
        code="""
            var ranges_out = [];
            var max = []
            var min = []
            if (r0.length > 0) {
                for (var i = 0; i <= r0.length -1; i++) {
                    if (r0[i].visible) {
                        ranges_out.push(ranges_in[i])
                        min.push(ranges_in[i][0])
                        max.push(ranges_in[i][1])
                    }
                }
            }
            if (ranges_out.length > 0) {
              var [low, high] = [Math.min.apply(null, min),  Math.max.apply(null, max)]
            } else {
              var [low, high] = total
            }
            y_range.start = low - low*0.1
            y_range.end = high*1.1
            """,
        args={
            'ranges_in': ranges_in,
            'r0': p.renderers,
            'total': [p.y_range.start, p.y_range.end],
            'y_range': p.y_range
        })
    for layer in range(len(p.renderers)):
        p.renderers[layer].js_on_change('visible', callback)

data_plot_opts = dict(muted_alpha = 0., default_tools=['pan','box_select','reset','wheel_zoom', 'save'], active_tools =['box_select'])

df = pd.DataFrame(
    {'x': list(range(1, 31)) + list(range(1, 31)) + list(range(1, 31)),
     'y': list((random.sample(range(0,30), 30) + random.sample(range(30, 60), 30) + random.sample(range(60, 90), 30))),
     'level': ['A'] * 30 + ['B'] * 30 + ['C'] * 30
    })

grouped = hv.Dataset(df, kdims=['x', 'level'], vdims=['y']).to(hv.Curve, 'x', 'y')
curves = grouped.overlay('level').opts(width=900, height=500, show_grid=True)
pn.Column(curves.opts(width=400, height=400, hooks=[hook]))

As mentioned above there is an issue with NaN’s. When variable has all NaN’s (in my prod solutions same happens also when variable consist of some NaN’s and some real values) something terrible is happening. Any ideas?

df.loc[30:59, 'y'] = np.nan

grouped = hv.Dataset(df, kdims=['x', 'level'], vdims=['y']).to(hv.Curve, 'x', 'y')
curves = grouped.overlay('level').opts(width=900, height=500, show_grid=True)
pn.Column(curves.opts(width=400, height=400, hooks=[hook]))

capture2

1 Like

Hi, Is it possible to create similar graph but with GeoViews (gv.Points) and ability to hover on each legend group?

Thanks!

1 Like

@kaane8520 Hi, I wanted to put a legend on GeoViews (gv.Points). Did you find the solution to your question above? Thanks.