I am trying to replicate a purely matplotlib plot using HoloViz but I am having a hard time getting the details right. For instance overlaying geoviews.feature hides the data but if I put them in front as so
GZ_plot = ds.GZ.hvplot.contour()
TT_plot = ds.TT.hvplot.quadmesh()
basemap = (
gv.feature.coastline
# * gv.feature.land
* gv.feature.borders
* gv.feature.lakes
).opts(projection=ds_crs)
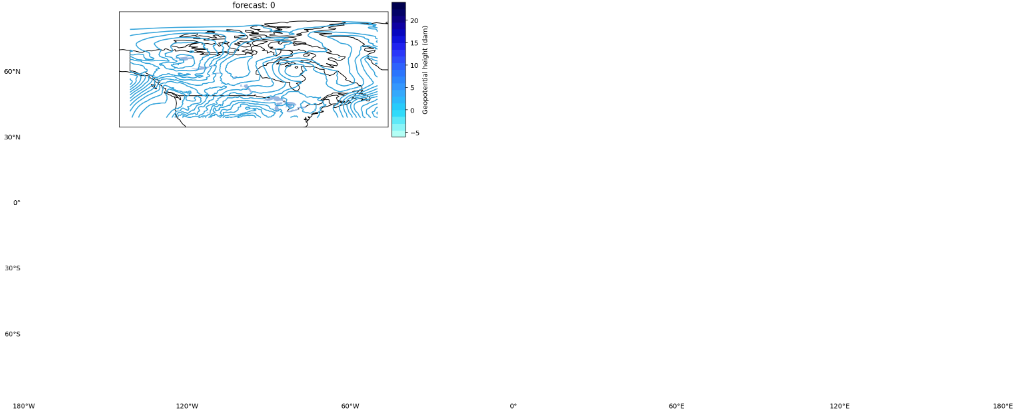
for domain_name, domain_extents in DOMAINS.items():
ds_reg = ds.sel(lon=slice(domain_extents[0],domain_extents[1]), lat=slice(domain_extents[2],domain_extents[3]))
final_plot = ds_reg.GZ.hvplot.contour(levels=20).opts(fig_size=300) * basemap
# final_plot = basemap * ds_reg.GZ.hvplot.contour(levels=20).opts(fig_size=200)
display(final_plot)
instead of
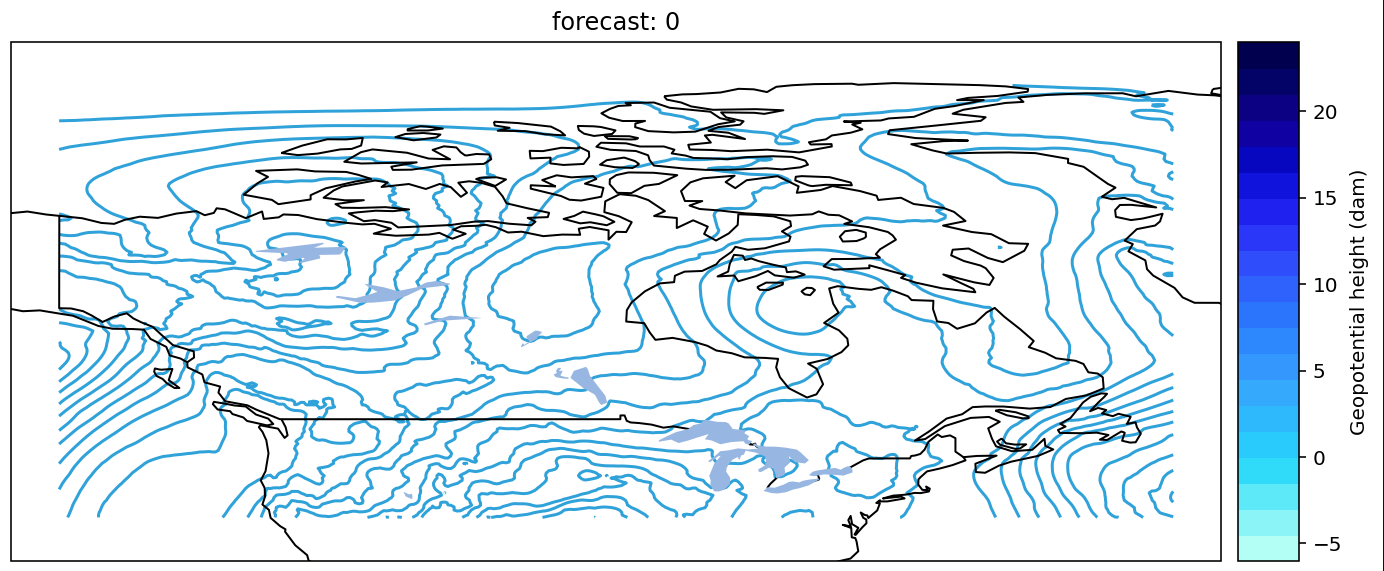
How would I control the z order (to use web lingo) in HoloViz overlays?