Hi all,
I just need to show a map on the background of my spatial data.
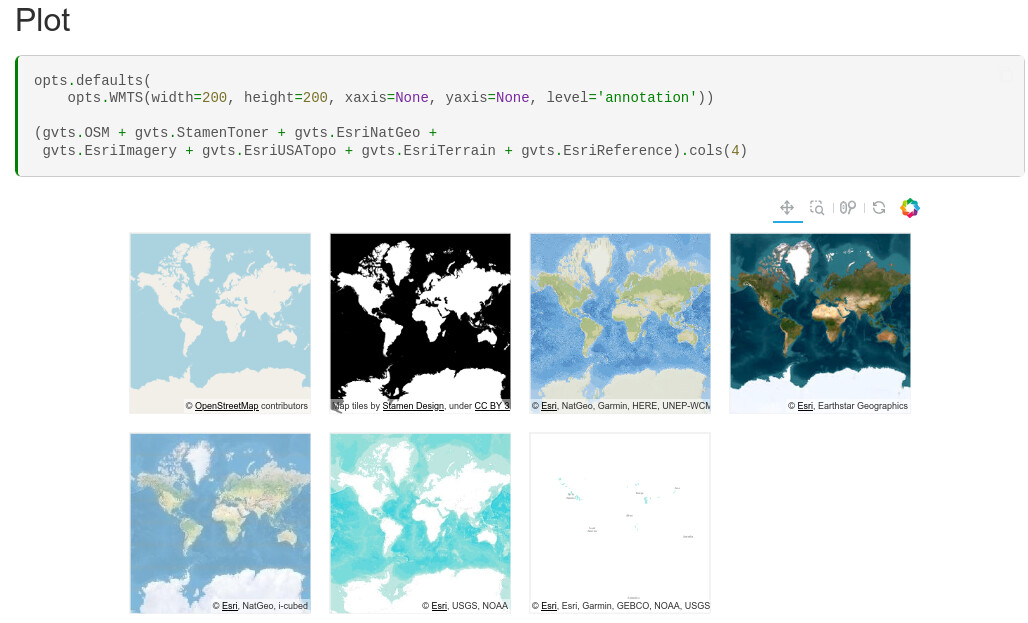
First, following the doc I was able to see the maps showing as expected. So I concluded that the installation went well.
Now, I want to just plot OSM.
Second, following this doc I see the blank boxes.
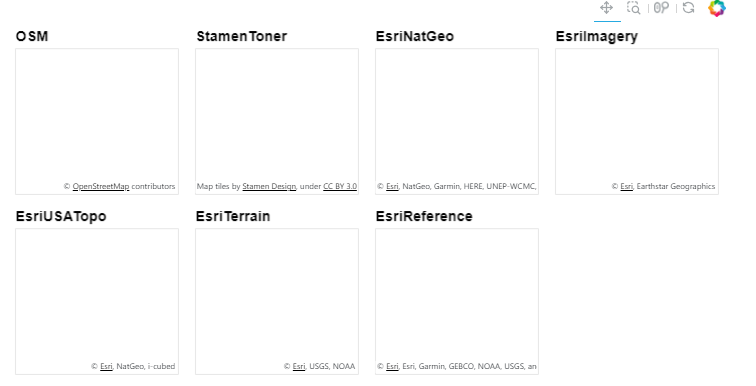
Then I tried to just plot the OSM by adding an if condition to the code from first doc, again a blank box showing.
- What am I missing?
- Is there a doc/example that I can follow to add map on the background of my plot?
Third, I realized that maybe I need some real data for the OSM map to show on the plot. So I followed this doc to test it. This time, the map displays as expected, but no data is showing. Refreshing the screen, I noticed that first I see 3 dots, then the map literally overlays them, so eventually the dots are hidden behind the map and they don’t show on the plot.
I appreciate your help.