Hi,
I recently installed geoviews on a server, to be used together with JupyterLab. Installation following the instructions from geoviews.org work without problem. Then I tried to reproduce the airports graph but I did not get the right output.
The first cell:
import pandas as pd
import geoviews as gv

from geoviews import opts
from bokeh.sampledata.airport_routes import airports, routes

gv.extension('bokeh')
works without any problem. So does the second cell:
# Count the number of connections from each airport
counts = routes.groupby('SourceID')[['Stops']].count().reset_index().rename(columns={'Stops': 'Connections'})
airports_df = pd.merge(airports, counts, left_on='AirportID', right_on='SourceID', how='left')
# Select only US mainland airports & convert from Mercator to Latitudes/Longitudes
airport_points = gv.Points(airports_df, ['Longitude', 'Latitude']).select(Longitude=(-170, -50), Latitude=(0, 50))
# Declare nodes, graph and tiles
nodes = gv.Nodes(airport_points, ['Longitude', 'Latitude', 'AirportID'],
['Name', 'City', 'Connections'])
graph = gv.Graph((routes, nodes), ['SourceID', 'DestinationID'], ['Source', 'Destination'])
tiles = gv.tile_sources.Wikipedia
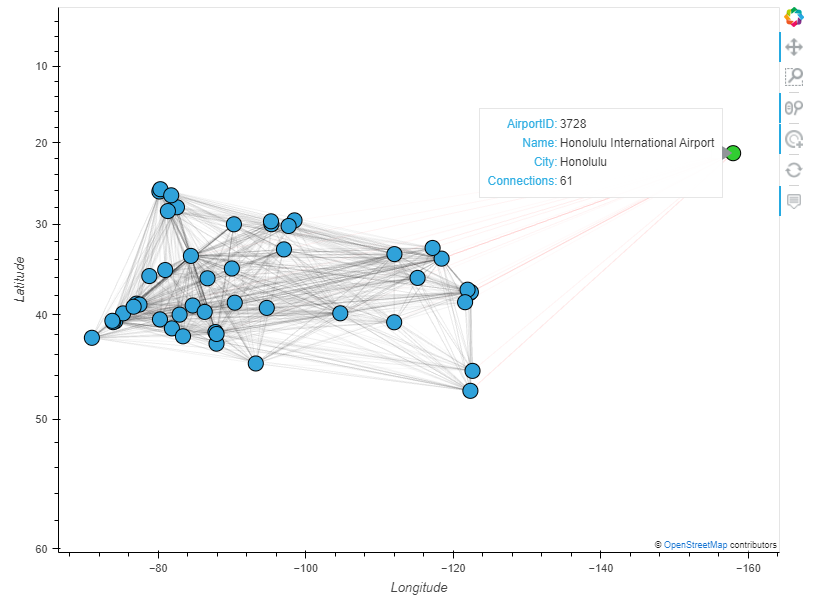
# Select 50 busiest airports
busiest = list(routes.groupby('SourceID').count().sort_values('Stops').iloc[-50:].index.values)
busiest_airports = graph.select(AirportID=busiest, selection_mode='nodes')
The third cell runs without any problem but the output is not as expected:
(tiles * busiest_airports).opts(
    opts.Graph(edge_selection_line_color='black', edge_hover_line_color='red',
               edge_line_width=1, edge_line_alpha=0.01, edge_nonselection_line_alpha=0.01,
               width=800, height=600))
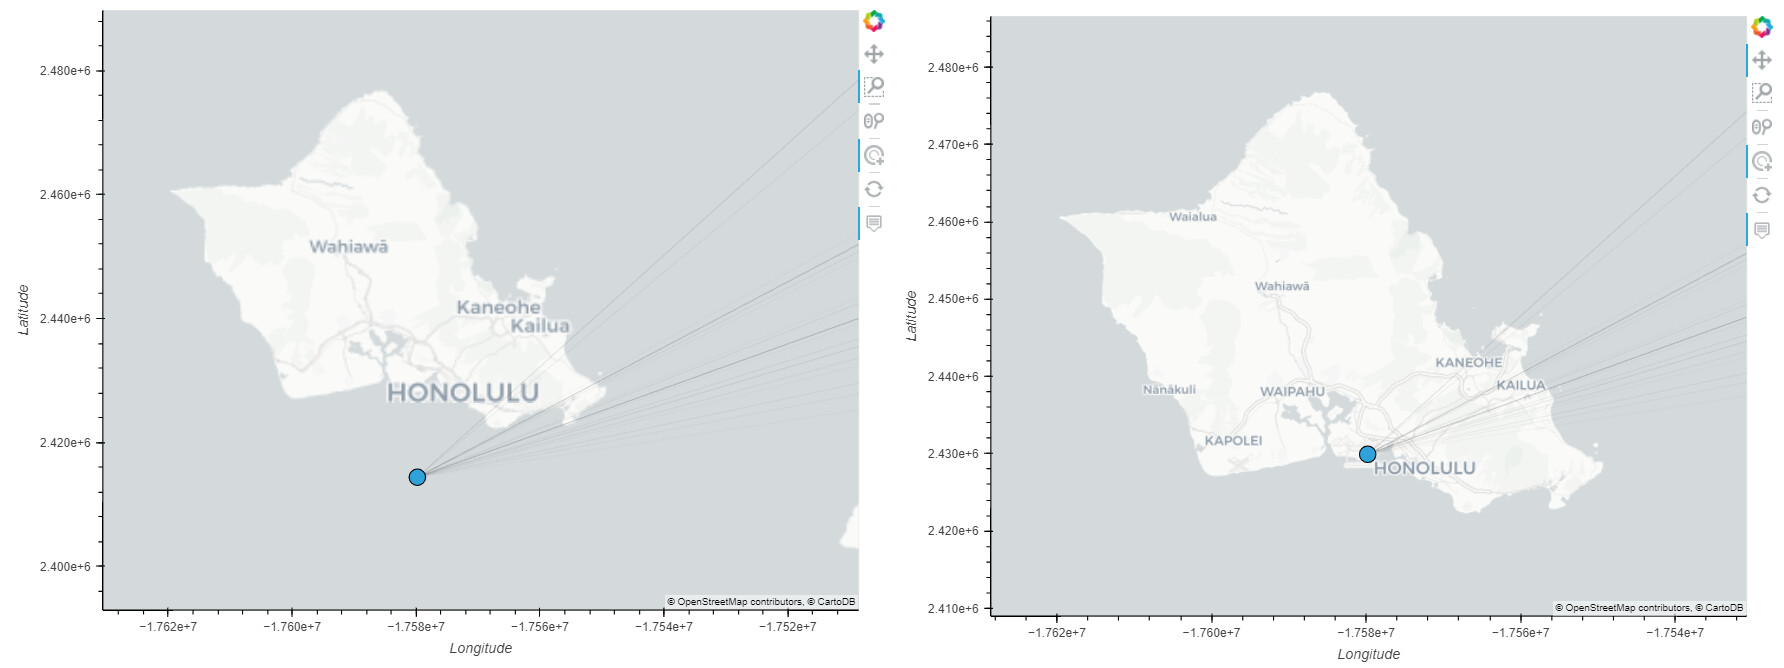
A graphical object is displayed but it looks empty. The zoom is not automatically set, so I need to zoom out manually (quite a bit, in fact). When I finally find the data, it is plotted with mirrored axis (latitude increasing from top to bottom, longitude decreasing from left to right), as you can see in the image below. The map does not appear either.
I originally thought that the problem could be due to some connection being blocked somewhere, but having the axis mirrored made me think this may be a different issue. When I try the code on a local installation of geoviews (that normally works fine) without internet connection the map is not displayed but the axis are not mirrored.
Regarding package versions, when I installed geoviews, the following packages were installed:
ca-certificates  {2021.5.30 (conda-forge/linux-64) -> 2021.7.5 (defaults/linux-64)}
certifi  {2021.5.30 (conda-forge/linux-64) -> 2021.5.30 (defaults/linux-64)}
conda  {4.10.1 (conda-forge/linux-64) -> 4.10.3 (defaults/linux-64)}
krb5  {1.18.2 (defaults/linux-64) -> 1.19.2 (defaults/linux-64)}
libcurl  {7.71.1 (defaults/linux-64) -> 7.78.0 (defaults/linux-64)}
libedit  {3.1.20191231 (defaults/linux-64) -> 3.1.20210216 (defaults/linux-64)}
sqlite  {3.33.0 (defaults/linux-64) -> 3.36.0 (defaults/linux-64)}
+bokeh-2.3.3 (defaults/linux-64)
+cairo-1.16.0 (defaults/linux-64)
+cartopy-0.18.0 (defaults/linux-64)
+cfitsio-3.470 (defaults/linux-64)
+cftime-1.5.0 (defaults/linux-64)
+click-7.1.2 (defaults/noarch)
+click-plugins-1.1.1 (defaults/noarch)
+cligj-0.7.2 (defaults/linux-64)
+colorcet-2.0.6 (pyviz/noarch)
+curl-7.78.0 (defaults/linux-64)
+cytoolz-0.11.0 (defaults/linux-64)
+dask-2021.7.2 (defaults/noarch)
+dask-core-2021.7.2 (defaults/noarch)
+datashader-0.13.0 (pyviz/noarch)
+datashape-0.5.4 (defaults/linux-64)
+distributed-2021.7.2 (defaults/linux-64)
+fiona-1.8.13.post1 (defaults/linux-64)
+freexl-1.0.6 (defaults/linux-64)
+fsspec-2021.7.0 (defaults/noarch)
+gdal-3.0.2 (defaults/linux-64)
+geopandas-0.9.0 (defaults/noarch)
+geopandas-base-0.9.0 (defaults/noarch)
+geos-3.8.0 (defaults/linux-64)
+geotiff-1.6.0 (defaults/linux-64)
+geoviews-1.9.1 (defaults/noarch)
+geoviews-core-1.9.1 (pyviz/noarch)
+giflib-5.2.1 (defaults/linux-64)
+hdf4-4.2.13 (defaults/linux-64)
+hdf5-1.10.6 (defaults/linux-64)
+heapdict-1.0.1 (defaults/noarch)
+holoviews-1.14.5 (pyviz/noarch)
+json-c-0.13.1 (defaults/linux-64)
+kealib-1.4.14 (defaults/linux-64)
+libdap4-3.19.1 (defaults/linux-64)
+libev-4.33 (defaults/linux-64)
+libgdal-3.0.2 (defaults/linux-64)
+libkml-1.3.0 (defaults/linux-64)
+libnetcdf-4.6.1 (defaults/linux-64)
+libnghttp2-1.41.0 (defaults/linux-64)
+libpq-12.2 (defaults/linux-64)
+libspatialindex-1.9.3 (defaults/linux-64)
+libspatialite-4.3.0a (defaults/linux-64)
+locket-0.2.1 (defaults/linux-64)
+mapclassify-2.4.3 (defaults/noarch)
+markdown-3.3.4 (defaults/linux-64)
+msgpack-python-1.0.2 (defaults/linux-64)
+multipledispatch-0.6.0 (defaults/linux-64)
+munch-2.5.0 (defaults/noarch)
+netcdf4-1.5.7 (defaults/linux-64)
+networkx-2.6.2 (defaults/noarch)
+openjpeg-2.3.0 (defaults/linux-64)
+panel-0.12.1 (pyviz/noarch)
+param-1.11.1 (pyviz/noarch)
+partd-1.2.0 (defaults/noarch)
+pixman-0.40.0 (defaults/linux-64)
+poppler-0.81.0 (defaults/linux-64)
+poppler-data-0.4.10 (defaults/linux-64)
+postgresql-12.2 (defaults/linux-64)
+proj-6.2.1 (defaults/linux-64)
+psutil-5.8.0 (defaults/linux-64)
+pyct-0.4.8 (pyviz/noarch)
+pyct-core-0.4.8 (pyviz/noarch)
+pyproj-2.6.1.post1 (defaults/linux-64)
+pyshp-2.1.3 (defaults/noarch)
+pyviz_comms-2.1.0 (pyviz/noarch)
+pyyaml-5.4.1 (defaults/linux-64)
+rtree-0.9.7 (defaults/linux-64)
+shapely-1.7.1 (defaults/linux-64)
+sortedcontainers-2.4.0 (defaults/noarch)
+tblib-1.7.0 (defaults/noarch)
+tiledb-2.2.9 (defaults/linux-64)
+toolz-0.11.1 (defaults/noarch)
+typing-extensions-3.10.0.0 (defaults/noarch)
+typing_extensions-3.10.0.0 (defaults/noarch)
+xarray-0.19.0 (defaults/noarch)
+xerces-c-3.2.3 (defaults/linux-64)
+zict-2.0.0 (defaults/noarch)
Does anyone know what can be wrong or where to start looking? I have not been able to find much information online.
Thanks!
/RicceB