Hello,
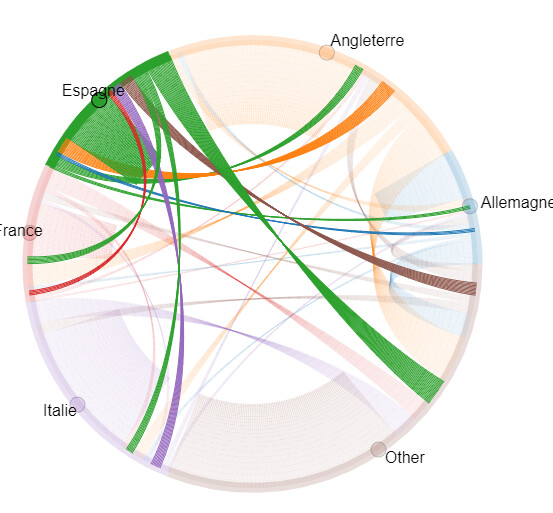
I’ve been facing a tiny issue with my python code when using HoloViews to make a chord diagram. It works perfectly fine, the only issue is when the graph is rendered, there’s this pop up that gets stuck whenever you hover over the label of the nodes…
Here’s an example: 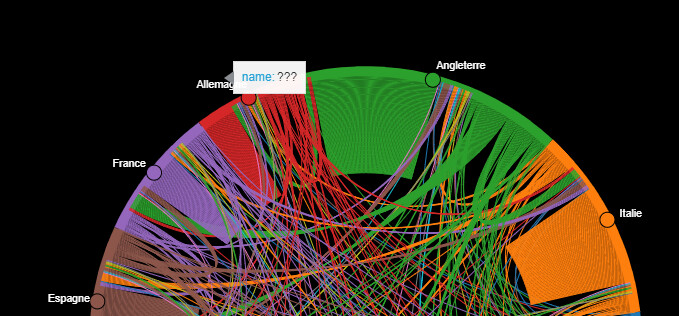
My code:
%%opts Chord [height=600 width=600 title="Transactions from 2000 to 2021" ]
#plot
#edit links = moves[moves['Transactions'] > x] // x refers to the number of transactions minimum for the diagram display
moves = moves[moves['Transactions']>5]
links = moves
chord = hv.Chord(links)
chord
nodesl = []
c = []
for i, row in moves.iterrows():
    c.append(row[0])
    c.append(row[1])

c = pd.DataFrame(c)
c.drop_duplicates(inplace=True)
c.reset_index(inplace=True)
c.drop(columns='index', inplace=True)
c

nodes = []
for i, row in c.iterrows():
    nodes.append({'name':row[0]})


nodes = pd.DataFrame(nodes)
# nodes

nodes = hv.Dataset(nodes, 'name')
nodes.data.head()


%%opts Chord [height=800 width=800  bgcolor="black"]
%%opts Chord [title="Transactions from 2000 to 2021 (Countries with over 5 moves)\nTip: Please do not hover over the label as it might produce a bug, else refresh the page" ]

chord = hv.Chord((links, nodes)).select(value=(5, None))

#this function allows text to fit perfectly on the screen
def rotate_label(plot, element):
    text_cds = plot.handles['text_1_source']
    length = len(text_cds.data['angle'])
    text_cds.data['angle'] = [0]*length
    xs = text_cds.data['x']
    text = np.array(text_cds.data['text'])
    xs[xs<0] -= np.array([len(t)*0.019 for t in text[xs<0]])

chord.opts(
    opts.Chord(cmap='Category10',
               edge_color=dim('Target').str(),
               node_color=dim('name').str(),
               labels='name',
               label_text_color="white",
               hooks=[rotate_label]
               ))
chord