I can’t figure out how to access the hover data or the tap data from an hvplot heatmap.
I’m trying:
hv.streams.SelectionXY(source=heatmap)

hv.streams.Selection1D(source=heatmap)

hv.streams.Tap(source=heatmap)
Creating the heatmap with:
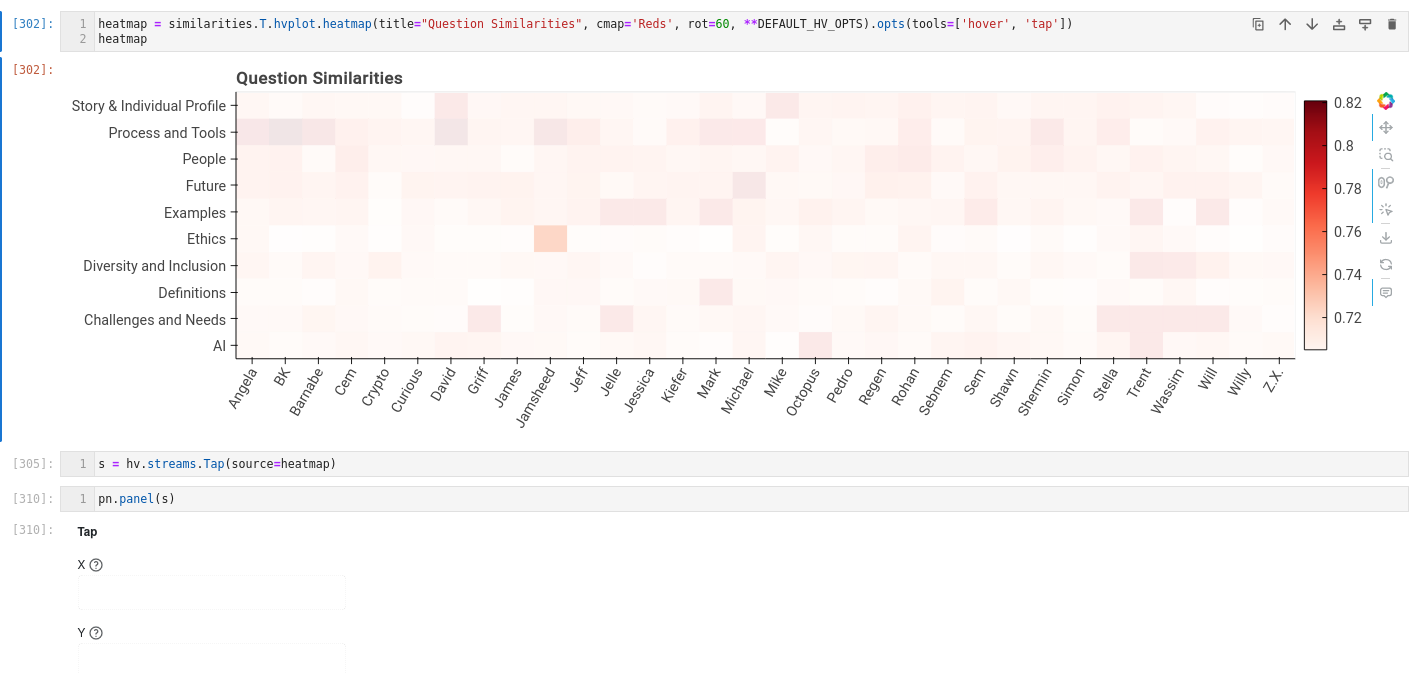
heatmap = similarities.T.hvplot.heatmap(title="Question Similarities", cmap='Reds', rot=60, **DEFAULT_HV_OPTS).opts(tools=['hover','tap'])
heatmap
This is how I’m trying to use it:
Thanks for testing; can you provide that as a code snippet that I can easily copy and paste (preferably with some sample/random data)
Sure.
import numpy as np
import pandas as pd
import hvplot.pandas
df = pd.DataFrame({'x':['a','b','c'],'y':[1,2,3],'v':[0.1,0.2,0.3]})
heatmap = df.hvplot.heatmap(x='x',y='y',C='v')
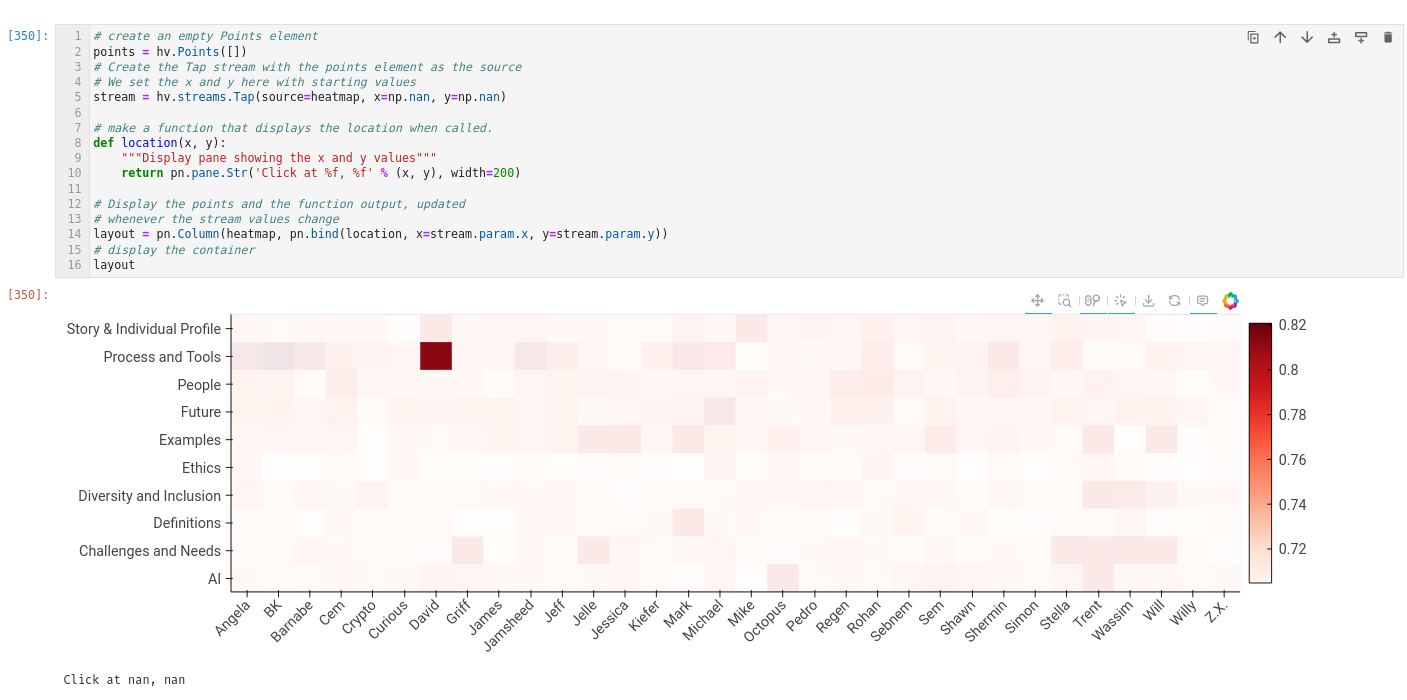
stream = hv.streams.Tap(source=heatmap, x=np.nan, y=np.nan)
# make a function that displays the location when called.
def location(x, y):
"""Display pane showing the x and y values"""
return pn.pane.Str('Click at %f, %f' % (x, y), width=200)
# Display the points and the function output, updated
# whenever the stream values change
layout = pn.Column(heatmap, pn.bind(location, x=stream.param.x, y=stream.param.y))
# display the container
layout
Using f’strings work; previously, x and y were passed as strings but %f expects floats.
import numpy as np
import pandas as pd
import holoviews as hv
import panel as pn
import hvplot.pandas
pn.extension()

df = pd.DataFrame({'x':['a','b','c'],'y':[1,2,3],'v':[0.1,0.2,0.3]})

heatmap = df.hvplot.heatmap(x='x',y='y',C='v')

stream = hv.streams.Tap(source=heatmap, x=np.nan, y=np.nan)

# make a function that displays the location when called.
def location(x, y):
    """Display pane showing the x and y values"""
    return pn.pane.Str(f'Click at {x}, {y}', width=200)

# Display the points and the function output, updated
# whenever the stream values change
layout = pn.Column(heatmap, pn.bind(location, x=stream.param.x, y=stream.param.y))
# display the container
layout
2 Likes
Oh wow that’s crazy… thanks!
1 Like