Hi all,
Is there any way to query from holoviews the actual rendered range of the x/y axis of the tiles?
I am trying to find the extents of the x/y axis for a holoviews.Tiles element that will be actually drawn as I am using holoviews.Tiles to generate a 2D texture that will then be mapped onto a 3D wavefront .obj mesh 3D object.
The issue is that to know the proper uv coordinates for the texture, I need to know the actual bounds of the rendered image and I cant seem to query these details from holoviews.
The bounds used for rendering are not what I set but seem to be extended based on the required pixel width/height and maintaining a 1:1 ratio of x/y for the tiles which makes sense.
A standalone example is below which produces the following rendered image (notice the y axis is larger than the bounding box):
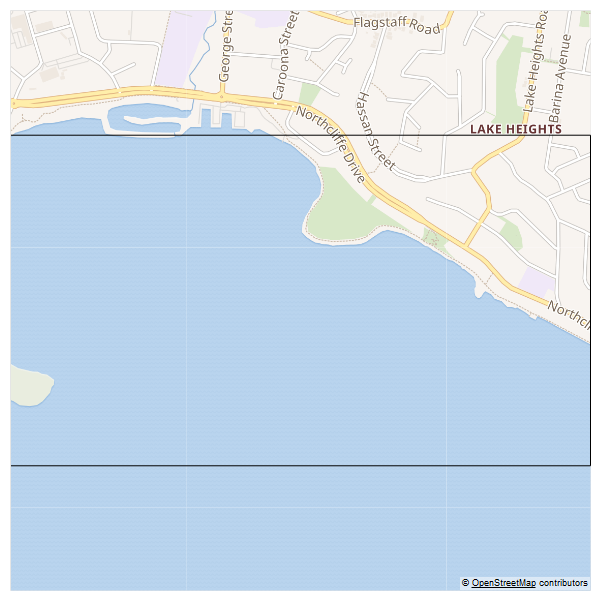
The output shows that when querying the extents/dimension range they don’t report the rendered range but the data range. Is there some way to obtain the larger range used in rendering?
tiles.extents:(None, None, None, None)
tiles.y_dim.range:(-4095604.7874389277, -4094051.5798278735)
tiles.y_dim.soft_range:(None, None)graph.y_dim.range:(-4095604.7874389277, -4094051.5798278735)
graph.y_dim.soft_range:(None, None)
Notice that all ranges queried are identical to bounds bottom:-4095604.7874389277, top:-4094051.5798278735 but the image generated is larger
Below is the stand alone code example
import holoviews

left, bottom = 16792083.677355718, -4095604.7874389277
right, top = 16794808.81422369, -4094051.5798278735

holoviews.extension('bokeh')
renderer = holoviews.renderer('bokeh').instance(mode='server')
tiles = holoviews.Tiles('https://maps.wikimedia.org/osm-intl/{Z}/{X}/{Y}@2x.png', name="Wikipedia").opts(width=600, height=600, xaxis=None, yaxis=None, toolbar=None)

# Adjust the framing of the tiles to show the area we care about and not the entire world
tiles = tiles.redim(
	x=holoviews.Dimension('x', range=(left, right)),
	y=holoviews.Dimension('y', range=(bottom, top))
	)

# Lets draw a box over the top to be clear where the original boundary is
bounds = holoviews.Bounds((left, bottom, right, top))
graph = holoviews.Overlay([tiles, bounds])

holoviews.save(graph, 'graph.png')

# Log possible locations to find the actual rendered range
y_dim = tiles.get_dimension(1)
print('tiles.extents:' + str(tiles.extents))
print('tiles.y_dim.range:' + str(y_dim.range))
print('tiles.y_dim.soft_range:' + str(y_dim.soft_range))

y_dim = graph.get_dimension(1)
# graph.extents doesnt exist for an Overlay
print('graph.y_dim.range:' + str(y_dim.range))
print('graph.y_dim.soft_range:' + str(y_dim.soft_range))

print ('Notice that all ranges queried are identical to bounds bottom:'+str(bottom)+', top:'+str(top)+' but the image generated is larger')
