Hi everyone ,
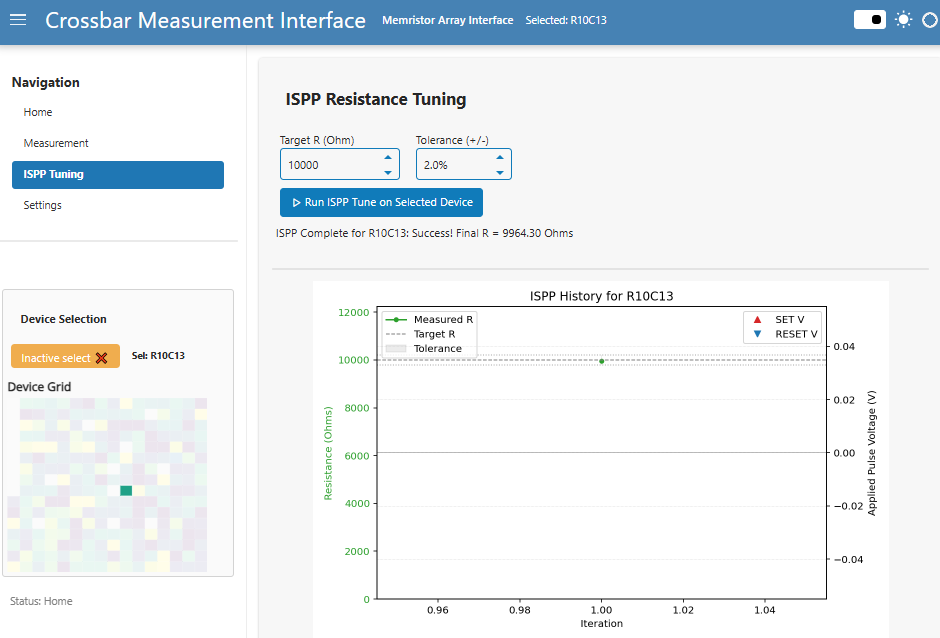
I wanted to share a recent project I am beggining to build and my 2 hour experience using panel together with gemini 2.5 pro. I’ve developed an application using panel for measuring state of the art non-volatile memories in South Korea.
I used Gemini extensively to help me to write, debug, and structure the code. This included figuring out best practices for the application’s architecture. I hadn’t used panel seriously for about 3 years, and I am very impressed with its progress. Gemini can manage itscomplex state management with multi page navigation, global initialization of resources, session management and asynchronous updates. Even the update with lock bokeh error was solved :). Aso note the matrix selector done with a a bokeh plot and some rect glyphs
Based on this experience, I found the combination of panel, and gemini to be incredibly powerful. For this type of custom lab instrumentation interface, it actually felt easier and more flexible to develop with than LabVIEW.
Here there is some screenshot and the code, but you can ask to gemini.
I am only sharing my experience, thanks again to Phillips, Marc and all developers of panel, it is being incredibly powerful ![]()
import panel as pn
import panel.template as pnt
import time, threading, atexit
import numpy as np, datetime
from bokeh.plotting import figure, ColumnDataSource
from bokeh.models import TapTool, HoverTool
import asyncio # For async callback
from bokeh import palettes # For colormaps
# Or use matplotlib colormaps:
# import matplotlib.cm as cm
# from bokeh.colors import RGB


#################################################################
# Style
#################################################################

# --- Custom CSS for Navigation ---
# Define this string early in your script, after imports.
# Selectors are simplified, assuming they are scoped to the component
# when passed via the 'stylesheets' parameter.
custom_nav_css_scoped = """
/* Add margin to the host element itself */
:host {
  display: block; /* Ensure margin works */
  margin-top: 5px;
}

/* Style the unordered list directly */
ul {
  list-style-type: none; /* Remove bullets */
  padding-left: 0;      /* Remove default padding */
  margin-bottom: 0;     /* Remove default bottom margin */
  margin-top: 0;        /* Remove potential top margin */
}

/* Style each list item */
li {
  margin-bottom: 4px; /* Add space between items */
}

/* Style the links within list items */
li a {
  display: block; /* Make the entire area clickable */
  padding: 8px 15px; /* Add padding inside the link */
  text-decoration: none; /* Remove underline */
  color: #333; /* Dark grey text color */
  border-radius: 4px; /* Slightly rounded corners */
  transition: background-color 0.2s ease-in-out, color 0.2s ease-in-out; /* Smooth transition */
  font-size: 0.95em; /* Slightly smaller font */
}

/* Style links on hover */
li a:hover {
  background-color: #e9ecef; /* Light grey background on hover */
  color: #0056b3; /* Darker blue text on hover */
}

/* Style for active/clicked link (optional) */
li a:active {
    background-color: #ced4da; /* Slightly darker background when clicked */
}
"""


# Set theme and load extensions
# Set default sizing_mode for Panel components if desired, can override later
pn.extension(sizing_mode="fixed") # Use 'fixed' as default, apply stretch explicitly

# --- Configuration ---
GRID_SIZE = 16
DEFAULT_COLOR = "lightgrey"
SELECTED_COLOR = "#1f77b4"

# Constants for Full Array Scan
FULL_SCAN_VMIN = -1.0
FULL_SCAN_VMAX = 1.0
FULL_SCAN_STEP = 0.05
FULL_SCAN_GATE = 0.0
CONDUCTANCE_VOLTAGE = 0.1 # Voltage (V) at which to calculate conductance
# --- Define Conductance Range and Colormap ---
# These might need tuning based on your simulation results
MIN_CONDUCTANCE = 0.1 # Adjust based on expected min G = I/V
MAX_CONDUCTANCE = 1.5 # Adjust based on expected max G = I/V
COLOR_PALETTE = palettes.Viridis256 # Choose a Bokeh palette (e.g., Viridis, Inferno, Magma)
# COLOR_PALETTE = palettes.Plasma256
# COLOR_PALETTE = palettes.Inferno256

#################################################################
# --- Server Initialization & Cleanup ---
#################################################################

server_start_time = datetime.datetime.now()
print(f"Script loaded at: {server_start_time}")

def initialize_server_resources():
    """Function called once when the Panel server loads the app."""
    print(f"--- Server Initialization ({datetime.datetime.now()}) ---")
    # Example: Load a large data file, initialize hardware connection (placeholder)
    pn.state.cache['server_start_time'] = server_start_time
    pn.state.cache['global_config'] = {"status": "Initialized", "version": "1.1"}

    if not hasattr(pn.state, '_server_initialized'):
        print("--- Running Server Initialization ---")
        pn.state.cache['shared_resource'] = f"Resource Loaded at Startup {time.time():.2f}"
        pn.state._server_initialized = True
        print("--- Server Initialization Complete---")


    print("Global resources initialized.")
    # Note: Objects stored in pn.state.cache here are shared across all sessions

def cleanup_on_exit():
    """Function called when the Python process exits."""
    print(f"\n--- Server Shutting Down ({datetime.datetime.now()}) ---")
    # Example: Close hardware connections, save final state, log shutdown
    print("Performing cleanup tasks...")
    # If managing external resources like serial ports opened by the server:
    # close_all_server_ports() # Placeholder for your closing logic
    print("Cleanup complete. Server exiting.")


# Register the functions
pn.state.onload(initialize_server_resources)
atexit.register(cleanup_on_exit)


# --- Simulation Function (Updated) ---
def simulate_iv_curve(row, col, vmin, vmax, step, gate_v):
    """Generates I-V curve data using measurement parameters."""
    print(f"Simulating R{row}C{col}: Vmin={vmin}, Vmax={vmax}, Step={step}, Gate={gate_v}")
    if step == 0: step = 0.01 # Avoid zero step
    # Ensure vmax is reachable from vmin with step
    num_points = int(np.floor((vmax - vmin) / step)) + 1
    voltage = np.linspace(vmin, vmin + (num_points - 1) * step, num_points)
    # Ensure voltage doesn't significantly exceed vmax due to floating point
    voltage = np.clip(voltage, vmin, vmax)

    # Simulate device characteristics influenced by position and gate voltage
    resistance = 1 + (row + col * GRID_SIZE) / (GRID_SIZE*GRID_SIZE*1.5) # Base resistance
    gate_factor = 1 + gate_v * 0.1 # Gate voltage effect
    current = (voltage / (resistance * gate_factor)) + np.random.normal(0, 0.05, size=voltage.shape)
    threshold = 0.5 + (row % 4) * 0.1
    current[np.abs(voltage) > threshold] *= (1.1 + gate_v * 0.05) # Non-linearity influenced by gate

    return dict(voltage=voltage.tolist(), current=current.tolist())


#################################################################
# --- Bokeh Plot and CDS Creation ---
#################################################################

# Grid Selector CDS (no change)
def create_grid_cds(size=GRID_SIZE):
    x_coords = np.arange(size) + 0.5; y_coords = np.arange(size) + 0.5
    xx, yy = np.meshgrid(x_coords, y_coords)
    grid_x = xx.ravel(); grid_y = yy.ravel()
    colors = [DEFAULT_COLOR] * (size * size)
    rows = np.floor(grid_y - 0.5).astype(int); cols = np.floor(grid_x - 0.5).astype(int)
    ids = [f"R{r}C{c}" for r, c in zip(rows, cols)]
    return ColumnDataSource(data=dict(x=grid_x, y=grid_y, color=colors, row=rows, col=cols, id=ids))

# Grid Selector Plot (size suitable for footer, no toolbar)
def create_selector_plot(source, size=GRID_SIZE):
    hover = HoverTool(tooltips=[("Device", "@id"), ("Row", "@row"), ("Col", "@col")])
    tools = [TapTool(), hover, "pan", "wheel_zoom", "reset"]
    p = figure(height=250, width=250, # Reduced size for footer
               tools=tools, title="Device Grid",
               x_range=(0, size), y_range=(0, size),
               x_axis_location=None, y_axis_location=None,
               toolbar_location=None, match_aspect=True,
               min_border=0, outline_line_color=None)
    p.grid.visible = False
    p.rect(x='x', y='y', width=1, height=1, source=source,
           fill_color='color', line_color="white", line_width=1)
    tap_tool = p.select(type=TapTool); tap_tool.behavior = "select"
    return p

# I-V Curve CDS (no change)
def create_iv_cds():
    return ColumnDataSource(data=dict(voltage=[], current=[]))

# I-V Curve Plot (no change, sizing applied to pane later)
def create_iv_plot(source):
    p = figure(height=400, # Initial height, will stretch
               title="I-V Curve", x_axis_label="Voltage (V)", y_axis_label="Current (A)",
               tools="pan,wheel_zoom,box_zoom,reset,save")
    p.line('voltage', 'current', source=source, line_width=2, color="red")
    p.circle('voltage', 'current', source=source, size=4, color="red", alpha=0.6)
    # Enable responsive plot sizing within Bokeh figure itself
    p.sizing_mode = "stretch_both"
    return p


#################################################################
# --- Session Component Management ---
#################################################################

def get_or_create_session_components(session_id):
    """Manages creation/caching of all components for a session."""
    print(f"Session Components: Checking cache for session {session_id}")
    components_key = f'selector_page_components_{session_id}'

    if components_key in pn.state.cache: # retorna aqui si ya estan
        return pn.state.cache[components_key]

    print("Session Components: Creating new components for session.")

    # Create all components
    grid_cds = create_grid_cds()
    selector_plot = create_selector_plot(grid_cds)
    selector_pane = pn.pane.Bokeh(selector_plot, min_height=260) # Pane for footer selector

    iv_cds = create_iv_cds()
    iv_plot = create_iv_plot(iv_cds)
    iv_pane = pn.pane.Bokeh(iv_plot, sizing_mode="stretch_both") # Pane for main area IV plot

    # Widgets (for sidebar footer)
    selected_info = pn.widgets.StaticText(value="Selected: None", styles={'font-weight': 'bold', 'font-size': '9pt'}, align='center')

       # --- Create Toggle with Initial button_type ---
    initial_toggle_value = True
    initial_button_type = 'success' if initial_toggle_value else 'warning' # Set initial color
    tap_enabled_toggle = pn.widgets.Toggle(
        name="Enable Select",
        value=initial_toggle_value,
        button_type=initial_button_type, # Apply initial type
        margin=(0, 5), height=30, align='center'
    )


       # --- Measurement Control Widgets ---
    vmax_input = pn.widgets.FloatInput(name="Vmax (V)", value=1.5, step=0.1, width=90)
    vmin_input = pn.widgets.FloatInput(name="Vmin (V)", value=-1.5, step=0.1, width=90)
    step_input = pn.widgets.FloatInput(name="Step (V)", value=0.05, step=0.01, start=0.001, width=90)
    gate_input = pn.widgets.FloatInput(name="Gate V (V)", value=0.0, step=0.1, width=90)
    measure_button = pn.widgets.Button(name="Measure Selected Device", button_type="success", icon='settings-2', height=40)
    # --- NEW Full Array Button ---
    measure_all_button = pn.widgets.Button(name="Measure Full Array", button_type="primary", icon='grid', height=40, margin=(5,0,0,0))
    measurement_status = pn.widgets.StaticText(value="", styles={'font-size':'9pt', 'margin-left':'5px'})


    # Store last selected index tracker
    last_sel_key = f'selector_last_sel_{session_id}'
    pn.state.cache[last_sel_key] = [None]

    # Store components needed by callback
    callback_data = {
        'grid_cds': grid_cds, 'iv_cds': iv_cds, 'toggle': tap_enabled_toggle,
        'info': selected_info, 'last_sel_tracker': pn.state.cache[last_sel_key],
        # Add new measurement widgets
        'vmax': vmax_input, 'vmin': vmin_input, 'step': step_input, 'gate': gate_input,
        'status': measurement_status,
        'measure_all_button': measure_all_button
    }

    # Define the callback
    def handle_selection_change(attr, old, new):
        # (Callback logic remains exactly the same as previous correct version)
        cb_grid_cds = callback_data['grid_cds']
        cb_iv_cds = callback_data['iv_cds']
        cb_toggle = callback_data['toggle']
        cb_info = callback_data['info']
        cb_last_sel = callback_data['last_sel_tracker']

        if not cb_toggle.value: return # Ignore if toggle off

        vmin = callback_data['vmin'].value
        vmax = callback_data['vmax'].value
        step = callback_data['step'].value
        gate_v = callback_data['gate'].value

        print(f"Selection changed (Callback): {old} -> {new}")
        current_selection_index = None
        new_colors = list(cb_grid_cds.data['color'])
        if cb_last_sel[0] is not None and cb_last_sel[0] < len(new_colors): new_colors[cb_last_sel[0]] = DEFAULT_COLOR # Reset previous
        if new:
            current_selection_index = new[0]
            selected_row = cb_grid_cds.data['row'][current_selection_index]; selected_col = cb_grid_cds.data['col'][current_selection_index]
            selected_id = cb_grid_cds.data['id'][current_selection_index]
            cb_info.value = f"Sel: {selected_id}" # Update info text
            new_colors[current_selection_index] = SELECTED_COLOR # Update grid color
            cb_last_sel[0] = current_selection_index # Update tracker
            iv_data = simulate_iv_curve(selected_row, selected_col,
                                        vmin, vmax, step, gate_v)
            cb_iv_cds.data = iv_data # Update IV plot data
        else:
            cb_info.value = "Sel: None"; cb_last_sel[0] = None
            # cb_iv_cds.data = dict(voltage=[], current=[]) # Optional: clear IV on deselect

        cb_grid_cds.data['color'] = new_colors # Apply grid color changes


    # Callback for the Measure Button
    def measure_single_device_callback(event):
        print(f"Measure button clicked: {event}")
        # Retrieve components needed
        cb_iv_cds = callback_data['iv_cds']
        cb_last_sel = callback_data['last_sel_tracker']
        cb_grid_cds = callback_data['grid_cds'] # Need row/col
        cb_status = callback_data['status']
        # Read measurement parameters
        vmin = callback_data['vmin'].value
        vmax = callback_data['vmax'].value
        step = callback_data['step'].value
        gate_v = callback_data['gate'].value

        selected_index = cb_last_sel[0]
        if selected_index is None:
            print("Measurement Error: No device selected.")
            cb_status.value = "Error: No device selected!"
            # Clear plot?
            # cb_iv_cds.data = dict(voltage=[], current=[])
            return

        # Get selected device row/col
        selected_row = cb_grid_cds.data['row'][selected_index]
        selected_col = cb_grid_cds.data['col'][selected_index]
        selected_id = cb_grid_cds.data['id'][selected_index]

        cb_status.value = f"Measuring {selected_id}..."
        # Simulate Measurement and Update I-V Plot
        iv_data = simulate_iv_curve(selected_row, selected_col, vmin, vmax, step, gate_v)
        cb_iv_cds.data = iv_data # Assign new data to IV plot's CDS
        cb_status.value = f"Measured {selected_id}."
        print(f"Measurement complete for {selected_id}. Plot updated.")


    # --- NEW Callback for Toggle Button Color ---
    def update_toggle_color(event):
        """Updates the button_type based on the toggle value."""
        toggle_widget = event.obj # The widget that triggered the event
        if event.new: # If the new value is True (Toggle is ON)
            toggle_widget.button_type = 'success' # Greenish
            print("Toggle ON - Color set to success")
        else: # If the new value is False (Toggle is OFF)
            toggle_widget.button_type = 'warning' # Orangish/Reddish
            print("Toggle OFF - Color set to warning")

    # --- Async Callback for Full Array Measurement with next tick update---
    async def measure_full_array_callback(event):
        print(f"Measure Full Array button clicked: {event}")
        # Retrieve components needed by this callback instance
        cb_grid_cds = callback_data['grid_cds']
        cb_status = callback_data['status']
        cb_measure_all_button = callback_data['measure_all_button']

        # --- Ensure we have session context for scheduling ---
        if pn.state.curdoc is None:
            print("Error: No document context available for scheduling update.")
            cb_status.value = "Error: Cannot run scan (no session context)."
            return

        # --- Disable button and update status ---
        cb_measure_all_button.disabled = True
        cb_measure_all_button.name = "Measuring..."
        cb_status.value = "Starting full array scan..."
        await asyncio.sleep(0.01) # Allow UI update

        new_colors = [DEFAULT_COLOR] * (GRID_SIZE * GRID_SIZE) # Start fresh or use list(cb_grid_cds.data['color'])
        num_devices = GRID_SIZE * GRID_SIZE
        measured_count = 0
        scan_error = None

        try:
            for idx in range(num_devices):
                row = cb_grid_cds.data['row'][idx]
                col = cb_grid_cds.data['col'][idx]
                # device_id = cb_grid_cds.data['id'][idx] # Use for logging if needed

                iv_data = simulate_iv_curve(row, col,
                                            FULL_SCAN_VMIN, FULL_SCAN_VMAX,
                                            FULL_SCAN_STEP, FULL_SCAN_GATE)

                try:
                    current_at_v = np.interp(CONDUCTANCE_VOLTAGE, iv_data['voltage'], iv_data['current'])
                    conductance = 0 if abs(CONDUCTANCE_VOLTAGE) < 1e-9 else current_at_v / CONDUCTANCE_VOLTAGE
                except Exception as e:
                    print(f"Error calculating conductance for R{row}C{col}: {e}")
                    conductance = 0

                norm_g = np.clip((conductance - MIN_CONDUCTANCE) / (MAX_CONDUCTANCE - MIN_CONDUCTANCE), 0, 1)
                color_index = int(norm_g * (len(COLOR_PALETTE) - 1))
                new_colors[idx] = COLOR_PALETTE[color_index]

                measured_count += 1
                if measured_count % 16 == 0: # Update status periodically
                    cb_status.value = f"Measuring... ({measured_count}/{num_devices})"
                    await asyncio.sleep(0) # Yield control briefly

            print("Full scan simulation complete. Scheduling grid color update.")

            # --- Define synchronous function to update CDS ---
            def _apply_color_update(colors_to_apply):
                print("Applying color update via next_tick")
                try:
                    current_data = dict(cb_grid_cds.data) # Get current data structure
                    current_data['color'] = colors_to_apply # Set new colors
                    cb_grid_cds.data = current_data # Assign back - This is the safe Bokeh model change
                    print("Color update applied.")
                    # Update status *after* successful application
                    cb_status.value = "Full array scan complete. Grid updated."
                except Exception as e:
                    print(f"Error applying color update in next_tick: {e}")
                    cb_status.value = "Error updating grid visuals."

            # --- Schedule the update function ---
            # Use lambda to capture the current 'new_colors' list
            pn.state.curdoc.add_next_tick_callback(lambda: _apply_color_update(new_colors))
            # Update status to indicate update is scheduled
            cb_status.value = "Scan complete. Updating grid..."


        except Exception as e:
            scan_error = e
            cb_status.value = f"Error during scan: {e}"
            print(f"Error during full array scan: {e}")
        finally:
            # Re-enable button regardless of success/failure
            cb_measure_all_button.disabled = False
            cb_measure_all_button.name = "Measure Full Array"
            print("Button re-enabled.")
            # Don't update status here if success message is handled in next_tick callback
            # if not scan_error:
            #     cb_status.value = "Full array scan complete." # Or handled by next_tick


      # --- Attach Callbacks ---
    grid_cds.selected.on_change('indices', handle_selection_change)
    measure_button.on_click(measure_single_device_callback)
    tap_enabled_toggle.param.watch(update_toggle_color, 'value')
    measure_all_button.on_click(measure_full_array_callback)


    # Store components needed by layout functions
    session_components = {
        'selector_pane': selector_pane, 'iv_pane': iv_pane,
        'toggle': tap_enabled_toggle, 'info': selected_info,
        # Add measurement controls/button
        'vmax_input': vmax_input, 'vmin_input': vmin_input,
        'step_input': step_input, 'gate_input': gate_input,
        'measure_button': measure_button, 'measurement_status': measurement_status,
        'measure_all_button': measure_all_button
    }

    pn.state.cache[components_key] = session_components
    return session_components


#################################################################
# --- Page Content Functions ---
#################################################################
def page_home():
    return pn.Column(pn.pane.Markdown("## Home"),
                     pn.pane.Markdown("Welcome! Select Measurement from the sidebar."))

def page_settings():
     return pn.Column(pn.pane.Markdown("## Settings"), pn.widgets.Checkbox(name="Dummy setting"))

def page_selector_main(session_components): # MEASUREMENTS SELECTOR
    """Displays the I-V curve plot in the main area."""
    print("Rendering page_selector_main")
    # The iv_pane should already have sizing_mode='stretch_both'
    return pn.Column(
        pn.pane.Markdown("### I-V Curve Output"),
        session_components['iv_pane'], # Display the IV plot pane
        sizing_mode="stretch_both" # Make the outer Column stretch as well
    )


#################################################################
# --- Routing Function for Main Content ---
#################################################################

def get_page_content(url_hash):
    if pn.state.curdoc is None or pn.state.curdoc.session_context is None:
        return pn.pane.Markdown("Error: No session.")

    session_id = pn.state.curdoc.session_context.id
    page_route = url_hash.lstrip('#')
    print(f"Routing: Main content for hash '{page_route}'")

    # Get components - needed for the #selector route
    session_components = get_or_create_session_components(session_id)

    if page_route == "selector":
        return page_selector_main(session_components) # Pass components
    elif page_route == "settings":
        return page_settings()
    else: # Default to home page
        return page_home()


#################################################################
# --- Sidebar Footer Content/Routing (REVERTED TO SHOW SELECTOR) ---
#################################################################

def footer_home():
    return pn.widgets.StaticText(value="Status: Home",
                                 styles={'font-size': '10pt', 'color': 'grey'})

def footer_settings(): return pn.widgets.StaticText(value="Area: Config",
                                                    styles={'font-size': '10pt'})


# Routing function for Measurement Controls section in sidebar
def get_sidebar_measurement_controls(url_hash, session_components):
    page_route = url_hash.lstrip('#')
    if page_route == 'selector':
        # Arrange measurement controls
        controls_layout = pn.Column(
            pn.pane.Markdown("#### Measurement Setup"),
            pn.Row(session_components['vmin_input'], session_components['vmax_input']),
            pn.Row(session_components['step_input'], session_components['gate_input']),
            session_components['measure_button'],
            session_components['measure_all_button'],
            session_components['measurement_status'],
            sizing_mode='stretch_width'
        )
        return controls_layout
    else:
        return None # No controls on other pages


# Routing function for Sidebar Footer (Selector Grid + Toggle/Info)
def get_sidebar_footer_content(url_hash, session_components):
    page_route = url_hash.lstrip('#')

    if page_route == "selector":
        selector_footer_layout = pn.Column(
            pn.pane.Markdown("#### Device Selection"),
            pn.Row(session_components['toggle'], session_components['info'], styles={'margin-bottom': '5px'}),
            session_components['selector_pane'], # The grid plot pane
            styles={'border': '1px solid lightgrey', 'padding': '5px', 'border-radius': '4px', 'background': '#fafafa'},
            sizing_mode='stretch_width'
        )
        return selector_footer_layout

    elif page_route == "settings":
        return footer_settings()

    else: return footer_home()


# --- Main Application Creation Function ---
def create_app():
    template = pnt.FastListTemplate(
        title="Crossbar Measurement Interface",
        sidebar_width=300,
        header_background="#4682B4",
    )

    # Static Navigation
    navigation_md = pn.pane.Markdown("""
    ### Navigation
    * [Home](#home)
    * [Measurement](#selector)
    * [Settings](#settings)
    """, sizing_mode="stretch_width",
     stylesheets=[custom_nav_css_scoped])

    template.sidebar.append(navigation_md)
    template.sidebar.append(pn.layout.Divider())

    # --- Bind Dynamic Sidebar Sections ---
    # Need to get components once here to pass to both binding functions
    # Use pn.bind with a wrapper function or handle inside template logic
    # Simpler approach: bind separately, components will be fetched inside routing funcs

    # Bind Measurement Controls Section
    dynamic_sidebar_controls = pn.bind(
        # Need a wrapper lambda or ensure get_sidebar_measurement_controls fetches components
        lambda url_hash: get_sidebar_measurement_controls(url_hash, get_or_create_session_components(pn.state.curdoc.session_context.id)),
        url_hash=pn.state.location.param.hash
    )
    template.sidebar.append(pn.Column(dynamic_sidebar_controls, sizing_mode='stretch_width', margin=(5, 5, 15, 5))) # Add margin below controls

    # Bind Sidebar Footer Section (Selector Grid etc.)
    dynamic_sidebar_footer = pn.bind(
        # Need a wrapper lambda or ensure get_sidebar_footer_content fetches components
        lambda url_hash: get_sidebar_footer_content(url_hash, get_or_create_session_components(pn.state.curdoc.session_context.id)),
        url_hash=pn.state.location.param.hash
    )
    template.sidebar.append(pn.Column(dynamic_sidebar_footer, sizing_mode='stretch_width', margin=(15, 5, 5, 5)))


    # Bind Main Content Area
    dynamic_main_content = pn.bind(
        get_page_content, url_hash=pn.state.location.param.hash
    )
    template.main.append(pn.Column(dynamic_main_content, sizing_mode="stretch_both"))

    # Header
    template.header.append(pn.pane.Markdown("**Memristor Array Interface**", styles={'color': 'white'}))

    return template

# --- Serve the app ---
app_instance = create_app()
app_instance.servable()