Dear All,
is it possible to add more than 1 group in hvplot
for example with this dataframe:
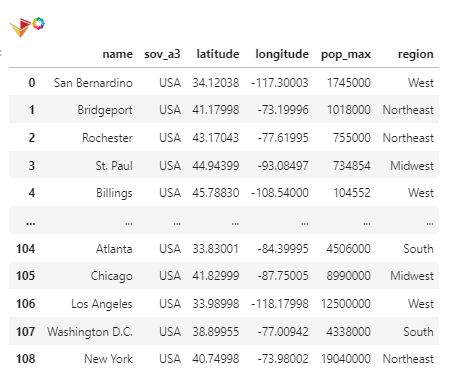
I can manage use 1 groupby “region” but if I want another column to be in groupby it will failed
working code:
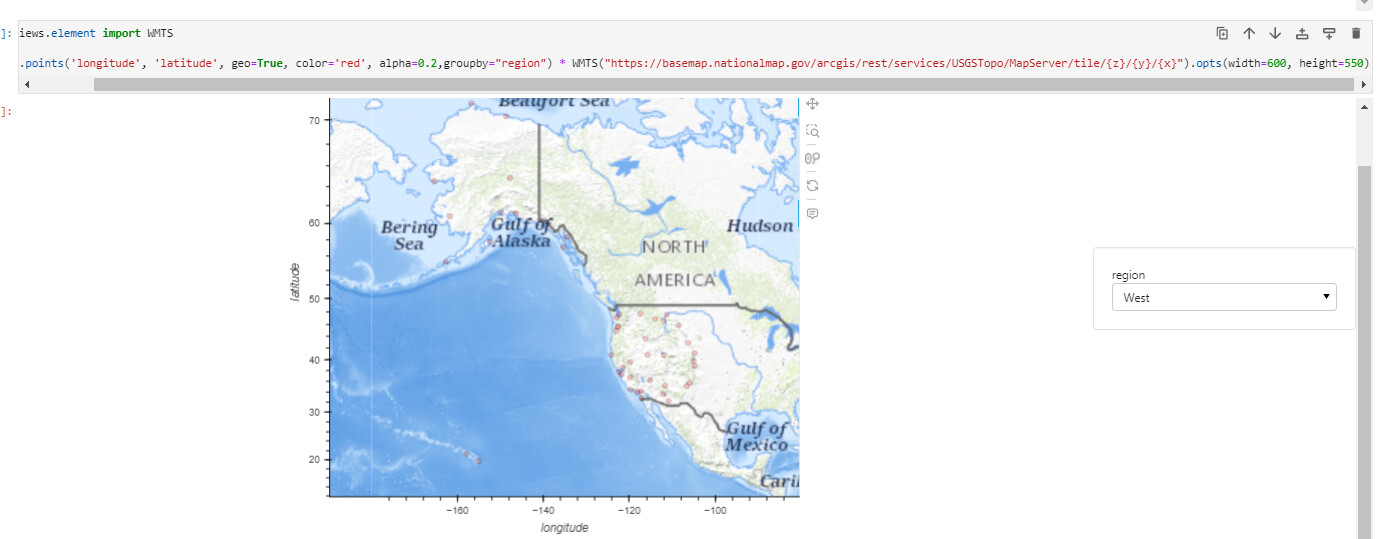
from geoviews.element import WMTS
df.hvplot.points(‘longitude’, ‘latitude’, geo=True, color=‘red’, alpha=0.2,groupby=“region”) * WMTS(“https://basemap.nationalmap.gov/arcgis/rest/services/USGSTopo/MapServer/tile/{z}/{y}/{x}”).opts(width=600, height=550)
failed :

How to fix this?