MikeBWx
September 18, 2023, 4:31pm
1
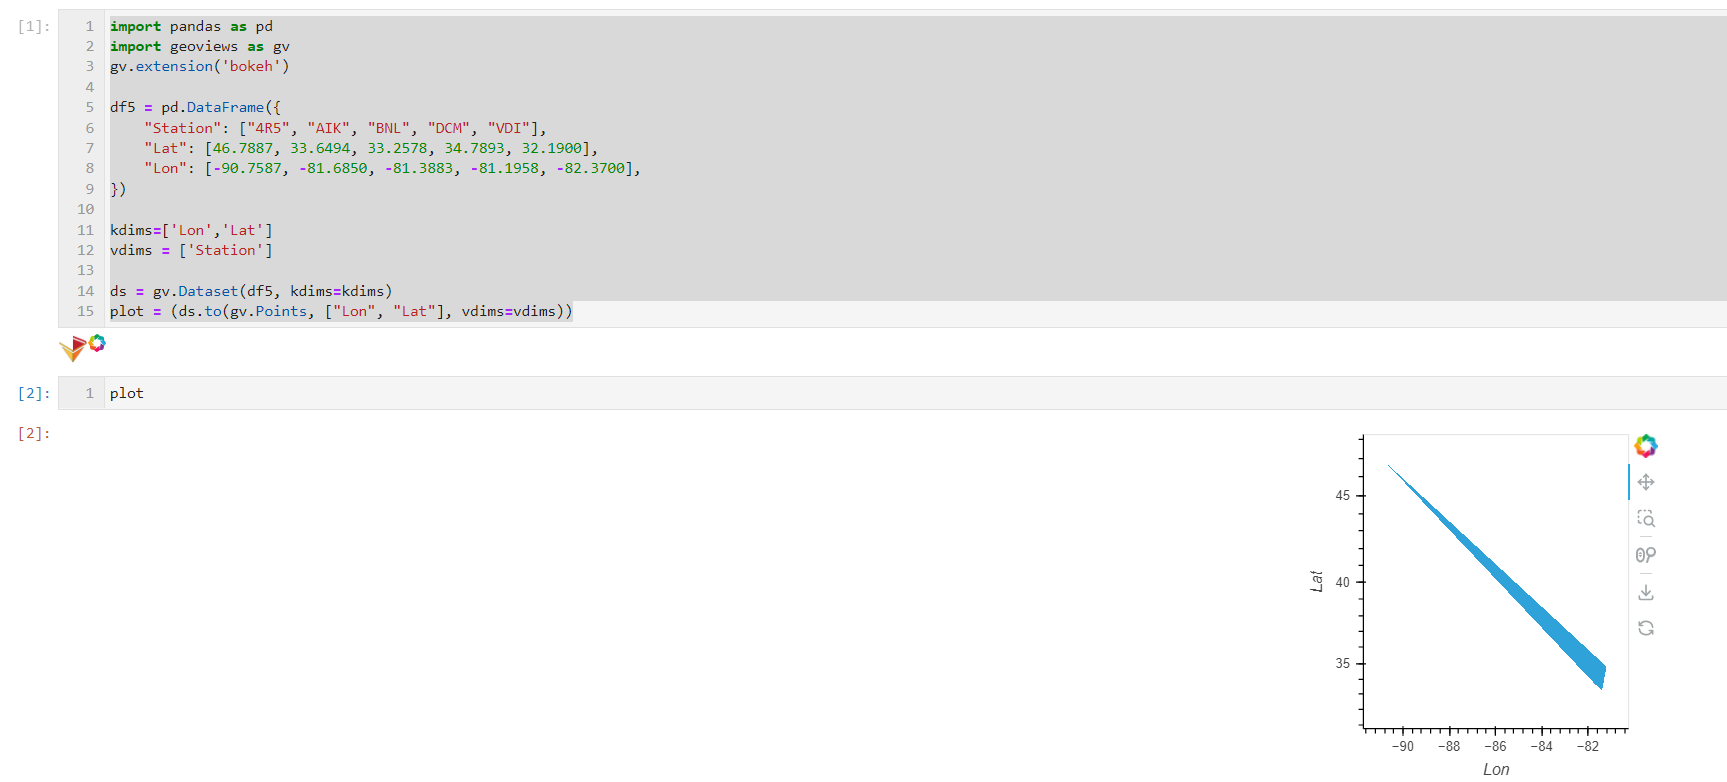
I am getting this issue in a jupyterlab environment where gv.points is not plotting properly.
geoviews: 1.10.1
‘’’
df5 = pd.DataFrame({
kdims=[‘Lon’,‘Lat’]
ds = gv.Dataset(df5, kdims=kdims)
Hoxbro
September 18, 2023, 4:51pm
2
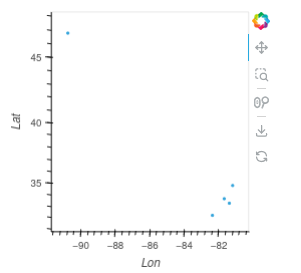
This is what I get:
What version of HoloViews?
MikeBWx
September 18, 2023, 4:57pm
3
it is holoviews version 1.17.0, could the issue be how things are rendering in jupyterlab?
Hoxbro
September 18, 2023, 5:21pm
4
Hard to say. Can you try running hv.show_versions?
MikeBWx
September 18, 2023, 5:47pm
5
Python : 3.11.4 | packaged by conda-forge | (main, Jun 10 2023, 18:08:17) [GCC 12.2.0]
bokeh : 3.2.1
robml
October 7, 2023, 12:12pm
6
From personal experience of something similar, I noticed I encounter this issue almost exclusively within notebooks. Does the problem persist when rendering in the browser instead?