hi @ahuang11 , thanks your suggestion. I have modify the code as below:
import pandas as pd
import numpy as np
import panel as pn
import hvplot.pandas
pn.extension('tabulator')
# Generate a synthetic dataset
np.random.seed(42)
data = {
    'Car': [f'Car_{i}' for i in range(1, 101)],
    'Year': np.random.choice([2019, 2020, 2021], size=100),
    'Brand': np.random.choice(['Toyota', 'Honda', 'Ford'], size=100),
    'Color': np.random.choice(['Red', 'Blue', 'Black', 'White'], size=100),
    'Value': np.random.rand(100) * 100,
    'Latitude': np.random.uniform(low=37, high=38, size=100),
    'Longitude': np.random.uniform(low=-122, high=-121, size=100),
    'Population': np.random.randint(50000, 1000000, size=100),
}
df = pd.DataFrame(data)

# Create Select widgets
year_select = pn.widgets.Select(name='Select Year', options=['All'] + list(df['Year'].unique()), value='All')
brand_select = pn.widgets.Select(name='Select Brand', options=['All'] + list(df['Brand'].unique()), value='All')
color_select = pn.widgets.Select(name='Select Color', options=['All'] + list(df['Color'].unique()), value='All')
latitude_input = pn.widgets.FloatInput(name='Center Latitude', value=37.5)
longitude_input = pn.widgets.FloatInput(name='Center Longitude', value=-121.5)
radius_input = pn.widgets.FloatInput(name='Radius (km)', value=999999)
# Function to filter DataFrame based on user input
# Function to calculate Haversine distance
def haversine_distance(lat1, lon1, lat2, lon2):
    R = 6371  # Radius of the Earth in kilometers
    dlat = np.radians(lat2 - lat1)
    dlon = np.radians(lon2 - lon1)
    a = np.sin(dlat / 2) ** 2 + np.cos(np.radians(lat1)) * np.cos(np.radians(lat2)) * np.sin(dlon / 2) ** 2
    c = 2 * np.arctan2(np.sqrt(a), np.sqrt(1 - a))
    distance = R * c
    return distance


def filter_dataframe(year, brand, color,center_latitude, center_longitude, radius):
    filtered_df = df.copy()

    if year != 'All':
        filtered_df = filtered_df[filtered_df['Year'] == int(year)]

    if brand != 'All':
        filtered_df = filtered_df[filtered_df['Brand'] == brand]

    if color != 'All':
        filtered_df = filtered_df[filtered_df['Color'] == color]

    if radius != '999999':
        distances = haversine_distance(center_latitude, center_longitude, df['Latitude'], df['Longitude'])
        filtered_df = df[distances <= radius].copy()
        filtered_df['Distance'] = distances[distances <= radius]
    return filtered_df

# Function to update Tabulator table based on user input
def update_table(year, brand, color,center_latitude, center_longitude, radius):
    filtered_df = filter_dataframe(year, brand, color, center_latitude, center_longitude, radius)
    tabulator_table.value = filtered_df


# Create a Tabulator table with the initial DataFrame
tabulator_table = pn.widgets.Tabulator(df, height=400, theme='site', pagination='remote')


# define plot function
def plot_scatter(year, brand, color, center_latitude, center_longitude, radius):
    plot_df = df.copy()

    if year != 'All':
        plot_df = plot_df[plot_df['Year'] == int(year)]

    if brand != 'All':
        plot_df = plot_df[plot_df['Brand'] == brand]

    if color != 'All':
        plot_df = plot_df[plot_df['Color'] == color]

    if radius != '999999':
        distances = haversine_distance(center_latitude, center_longitude, df['Latitude'], df['Longitude'])
        plot_df = df[distances <= radius].copy()
        plot_df['Distance'] = distances[distances <= radius]

    plot = plot_df.hvplot.scatter(x='Brand', y='Year', c='Color')
    return plot

# define callback function
@pn.depends(year_select.param.value,brand_select.param.value,color_select.param.value,latitude_input.param.value, longitude_input.param.value,radius_input.param.value)
def update_plot(year, brand, color, center_latitude, center_longitude, radius):
    plot = plot_scatter(year, brand, color, center_latitude, center_longitude, radius)
    return plot


# Create a Panel app layout
app_layout = pn.Column(
    pn.Row(year_select, brand_select, color_select, latitude_input, longitude_input, radius_input),
    pn.Row(tabulator_table),
    pn.Row(update_plot)
)

# Use pn.interact to update the Tabulator table interactively
pn.interact(update_table, year=year_select, brand=brand_select, color=color_select,center_latitude=latitude_input, center_longitude=longitude_input, radius=radius_input)

# Show the app
app_layout.show()
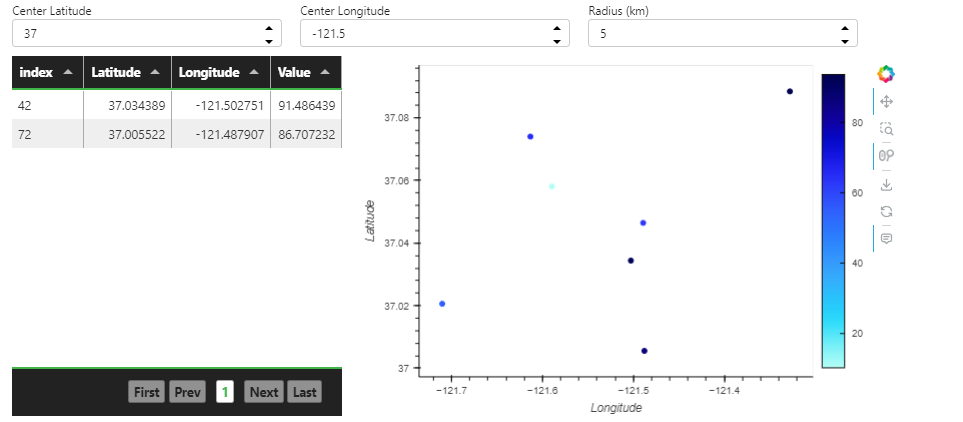
now we can change interactively when change lat,lon and radius but if we select another option there is no interaction at all, if we did’t include lat,lon and radius into filtering, it works to filter year, brand, color
import pandas as pd
import numpy as np
import panel as pn
import hvplot.pandas
pn.extension('tabulator')
# Generate a synthetic dataset
np.random.seed(42)
data = {
    'Car': [f'Car_{i}' for i in range(1, 101)],
    'Year': np.random.choice([2019, 2020, 2021], size=100),
    'Brand': np.random.choice(['Toyota', 'Honda', 'Ford'], size=100),
    'Color': np.random.choice(['Red', 'Blue', 'Black', 'White'], size=100),
    'Value': np.random.rand(100) * 100,
    'Latitude': np.random.uniform(low=37, high=38, size=100),
    'Longitude': np.random.uniform(low=-122, high=-121, size=100),
    'Population': np.random.randint(50000, 1000000, size=100),
}
df = pd.DataFrame(data)

# Create Select widgets
year_select = pn.widgets.Select(name='Select Year', options=['All'] + list(df['Year'].unique()), value='All')
brand_select = pn.widgets.Select(name='Select Brand', options=['All'] + list(df['Brand'].unique()), value='All')
color_select = pn.widgets.Select(name='Select Color', options=['All'] + list(df['Color'].unique()), value='All')
latitude_input = pn.widgets.FloatInput(name='Center Latitude', value=37.5)
longitude_input = pn.widgets.FloatInput(name='Center Longitude', value=-121.5)
radius_input = pn.widgets.FloatInput(name='Radius (km)', value=999999)
# Function to filter DataFrame based on user input
# Function to calculate Haversine distance
def haversine_distance(lat1, lon1, lat2, lon2):
    R = 6371  # Radius of the Earth in kilometers
    dlat = np.radians(lat2 - lat1)
    dlon = np.radians(lon2 - lon1)
    a = np.sin(dlat / 2) ** 2 + np.cos(np.radians(lat1)) * np.cos(np.radians(lat2)) * np.sin(dlon / 2) ** 2
    c = 2 * np.arctan2(np.sqrt(a), np.sqrt(1 - a))
    distance = R * c
    return distance


def filter_dataframe(year, brand, color):
    filtered_df = df.copy()

    if year != 'All':
        filtered_df = filtered_df[filtered_df['Year'] == int(year)]

    if brand != 'All':
        filtered_df = filtered_df[filtered_df['Brand'] == brand]

    if color != 'All':
        filtered_df = filtered_df[filtered_df['Color'] == color]


    return filtered_df

# Function to update Tabulator table based on user input
def update_table(year, brand, color):
    filtered_df = filter_dataframe(year, brand, color)
    tabulator_table.value = filtered_df


# Create a Tabulator table with the initial DataFrame
tabulator_table = pn.widgets.Tabulator(df, height=400, theme='site', pagination='remote')


# define plot function
def plot_scatter(year, brand, color):
    plot_df = df.copy()

    if year != 'All':
        plot_df = plot_df[plot_df['Year'] == int(year)]

    if brand != 'All':
        plot_df = plot_df[plot_df['Brand'] == brand]

    if color != 'All':
        plot_df = plot_df[plot_df['Color'] == color]


    plot = plot_df.hvplot.scatter(x='Brand', y='Year', c='Color')
    return plot

# define callback function
@pn.depends(year_select.param.value,brand_select.param.value,color_select.param.value)
def update_plot(year, brand, color):
    plot = plot_scatter(year, brand, color)
    return plot


# Create a Panel app layout
app_layout = pn.Column(
    pn.Row(year_select, brand_select, color_select),
    pn.Row(tabulator_table),
    pn.Row(update_plot)
)

# Use pn.interact to update the Tabulator table interactively
pn.interact(update_table, year=year_select, brand=brand_select, color=color_select,center_latitude=latitude_input, center_longitude=longitude_input, radius=radius_input)

# Show the app
app_layout.show()
is there anything I need to modify so I can use several filters for this example are filtered by year, brand, color, as well latitude, longitude and radius. kindly please advise.
thanks