Hello,
Since Tabulator widget can render a hierarchical multi-index and aggregate over specific categories, I want to have it in our dashboards. However, hierarchical rows not rendering correctly in data tabulator.
from bokeh.sampledata.population import data as population_data
import pandas as pd
import panel as pn
pn.extension()pop_df = population_data[population_data.Year == 2020].set_index([‘Location’, ‘AgeGrp’, ‘Sex’])[[‘Value’]]
df_widget = pn.widgets.Tabulator(value=pop_df, hierarchical=True, aggregators={‘Sex’: ‘sum’, ‘AgeGrp’: ‘sum’}, height=200)df_widget
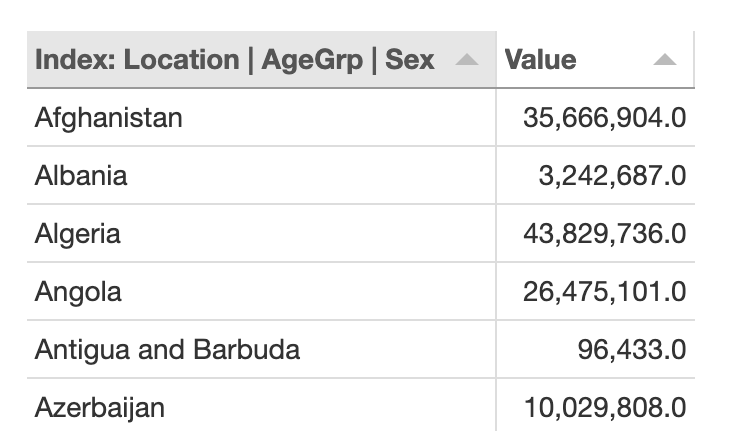
This is my output:
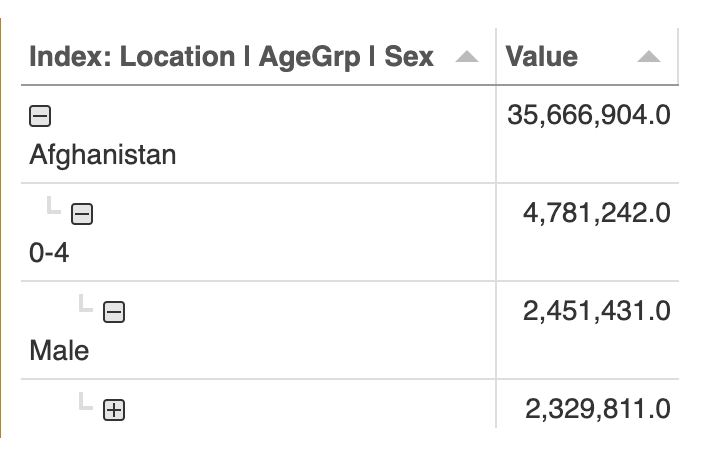
while it should be like:
Any idea?