This also works:
import numpy as np
import xarray as xr
import hvplot.xarray # noqa
import holoviews as hv
import panel as pn
# def sample_data(shape=(904, 999)):
def sample_data(shape=(90, 90)):
x = np.linspace(311.9, 391.1, shape[1])
y = np.linspace(-23.6, 24.8, shape[0])
x2d, y2d = np.meshgrid(x, y)
u = 10 * (2 * np.cos(2 * np.deg2rad(x2d) + 3 * np.deg2rad(y2d + 30)) ** 2)
v = 20 * np.cos(6 * np.deg2rad(x2d))
return x, y, u, v
xs, ys, U, V = sample_data()
mag = np.sqrt(U**2 + V**2)
angle = (np.pi / 2.0) - np.arctan2(U / mag, V / mag)
ds = xr.Dataset(
{
"mag": xr.DataArray(mag, dims=("y", "x"), coords={"y": ys, "x": xs}),
"angle": xr.DataArray(angle, dims=("y", "x"), coords={"y": ys, "x": xs}),
}
)
def subset_quiver(quiver, x_range, y_range, nmax=10):
if x_range is None or y_range is None:
return quiver
sub = ds.sel(x=slice(*x_range), y=slice(*y_range))
xs, ys = sub.x.size, sub.y.size
ix, iy = xs // nmax, ys // nmax
ix = 1 if ix <= 0 else ix
iy = 1 if iy <= 0 else iy
return quiver[x_range, y_range].iloc[::ix].iloc[::iy]
quiver = ds.hvplot.vectorfield(
x="x",
y="y",
mag="mag",
angle="angle",
hover=False,
width=300,
).opts(magnitude="mag")
range_xy = hv.streams.RangeXY(source=quiver)
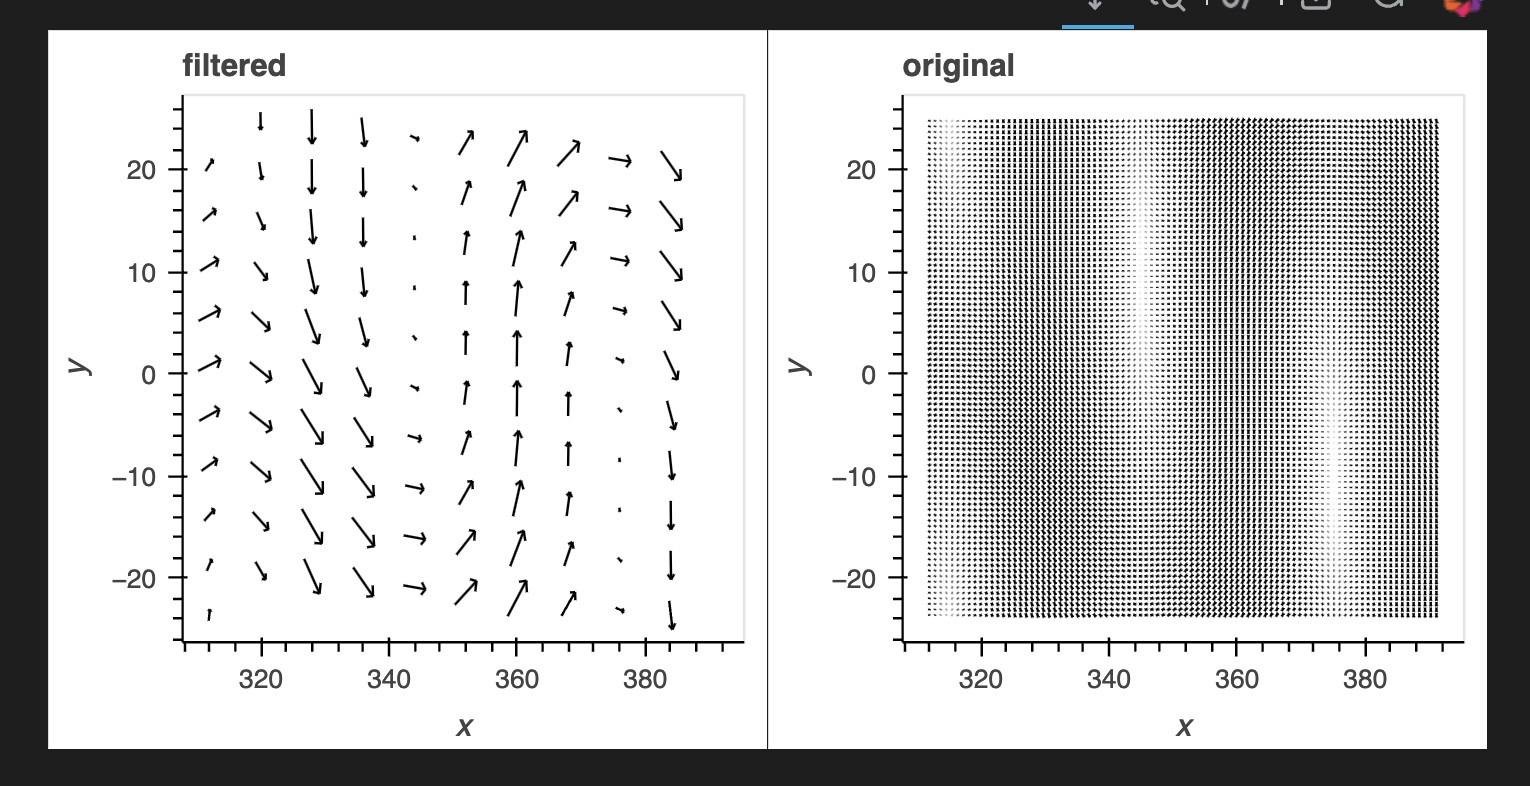
filtered = quiver.apply(subset_quiver, streams=[range_xy]).clone()
filtered.opts(title="filtered") + quiver.opts(title="original")