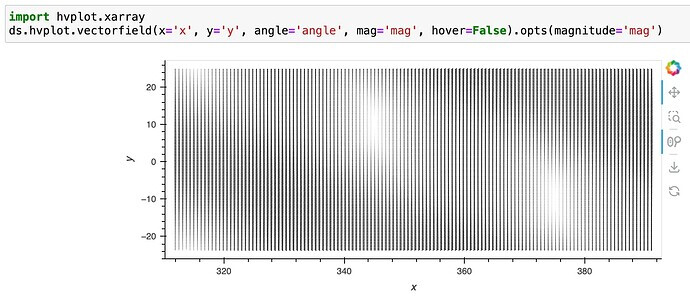
This starts with the problem discussed here. If we follow the example from documentation Vectorfield — hvPlot 0.9.0 documentation, but set to a high number of points, this is going to return either an overcrowded plot or memory error. Thanks @ahuang11 and @jbednar for the help with the discussion!
The solution is to create a streams to check the x and y range of the view and use that to check the size of the bins to perform a box average using xarray. Thus, zooming out will show the large scale, with increasing resolution by zooming in.
The example below works sharply with 2000 x 2000 = 4,000,000 points!!
To make it clear, the code works because it coarsen the data by box averaging to keep always 10 x 10 = 100 arrows in the view (user defined). Of course, if there is nothing to average, it will just show all arrows.
Full reproducible code:
import numpy as np
import xarray as xr
import hvplot.xarray  # noqa
import holoviews as hv
import panel as pn


def sample_data(shape=(2000, 2000)):
    x = np.linspace(311.9, 391.1, shape[1])
    y = np.linspace(-23.6, 24.8, shape[0])

    x2d, y2d = np.meshgrid(x, y)
    u = 10 * (2 * np.cos(2 * np.deg2rad(x2d) + 3 * np.deg2rad(y2d + 30)) ** 2)
    v = 20 * np.cos(6 * np.deg2rad(x2d))

    return x, y, u, v


xs, ys, U, V = sample_data()

mag = np.sqrt(U**2 + V**2)
angle = (np.pi / 2.0) - np.arctan2(U / mag, V / mag)

ds = xr.Dataset(
    {
        "mag": xr.DataArray(mag, dims=("y", "x"), coords={"y": ys, "x": xs}),
        "angle": xr.DataArray(angle, dims=("y", "x"), coords={"y": ys, "x": xs}),
    }
)


def create_quiver(x_range, y_range, nmax = 10):
    if x_range is None or y_range is None:
        xs, ys = ds.x.size, ds.y.size
        ix, iy = xs // nmax, ys // nmax

        ix = 1 if ix <= 0 else ix
        iy = 1 if iy <= 0 else iy

        sub = ds.coarsen(x = ix, y = iy, side = "center", boundary = "trim").mean()
        quiver = sub.hvplot.vectorfield(
            x="x",
            y="y",
            mag="mag",
            angle="angle",
            hover=False,
        ).opts(magnitude="mag")
        return quiver

    sub = ds.sel(x = slice(*x_range), y = slice(*y_range))

    xs, ys = sub.x.size, sub.y.size
    ix, iy = xs // nmax, ys // nmax

    ix = 1 if ix <= 0 else ix
    iy = 1 if iy <= 0 else iy

    sub = sub.coarsen(x = ix, y = iy, side = "center", boundary = "trim").mean()

    quiver = sub.hvplot.vectorfield(
        x="x",
        y="y",
        mag="mag",
        angle="angle",
        hover=False,
    ).opts(magnitude="mag")

    return quiver


range_xy = hv.streams.RangeXY()
filtered = hv.DynamicMap(create_quiver, streams=[range_xy])
range_xy.source = filtered
filtered