Hi, I’m trying to plot a histogram of a data frame’s columns, while comparing between different groups.
here is an example of what I’m doing:
import numpy as np
import pandas as pd
import hvplot.pandas # noqa

df = pd.DataFrame(np.random.rand(1000, 2), columns=['a','b'])
df['group'] = np.random.choice(['A', 'B'], 1000)
df.hvplot.hist(['a', 'b'], by='group', subplots=True, alpha=0.7)
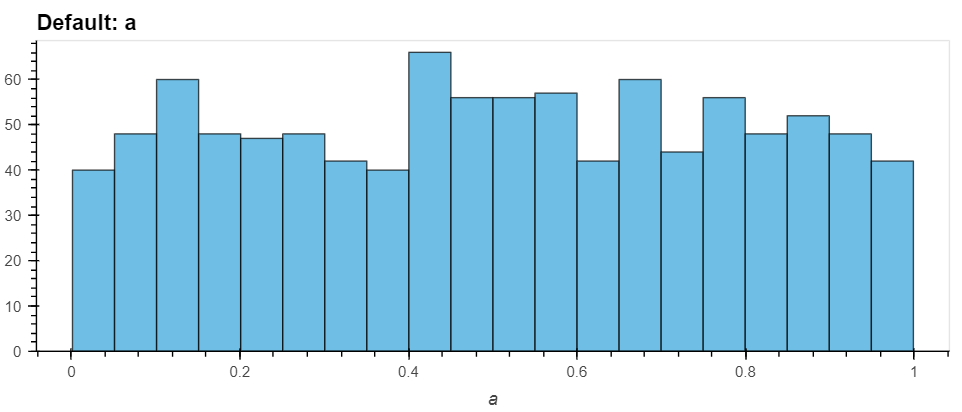
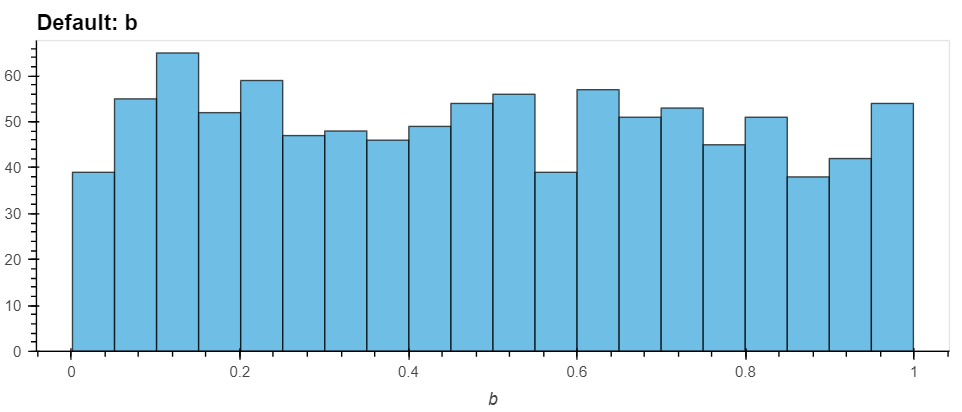
As you can see the resulting plots show the histograms without comparing the groups.
Is this the desired behavior of the function? if not is there a way to make it work as I wish?