Histogram Labels

I have been using the linked_brushing examples from here:
http://holoviews.org/user_guide/Linked_Brushing.html

In particular this one:

import datashader as ds
import holoviews.operation.datashader as hd

num = 100000
np.random.seed(1)

dists = {
    cat: pd.DataFrame({
        'x': np.random.normal(x, s, num), 
        'y': np.random.normal(y, s, num), 
        'val': np.random.normal(val, 1.5, num), 
        'cat': cat
    }) for x,  y,  s,  val, cat in 
     [(  2,  2, 0.03, 10, "d1"), 
      (  2, -2, 0.10, 20, "d2"), 
      ( -2, -2, 0.50, 30, "d3"), 
      ( -2,  2, 1.00, 40, "d4"), 
      (  0,  0, 3.00, 50, "d5")]
}

points = hv.Points(pd.concat(dists), ['x', 'y'], ['val', 'cat'])
datashaded = hd.datashade(points, aggregator=ds.count_cat('cat'))
spreaded = hd.dynspread(datashaded, threshold=0.50, how='over')

# Declare dim expression to color by cluster
dim_expr = ((0.1+hv.dim('val')/10).round()).categorize(hv.Cycle('Set1').values)
histogram = points.hist(num_bins=60, adjoin=False, normed=False).opts(color=dim_expr)

link_selections(spreaded + histogram)

In my use case I am trying to get text labels above the histogram bars, but searching through the documentation, I have not found a mechanism to do so.

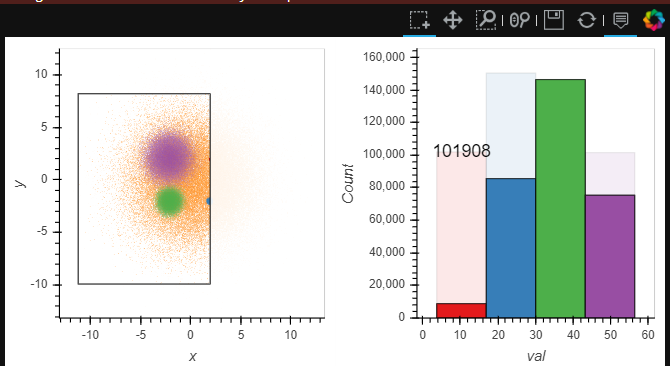
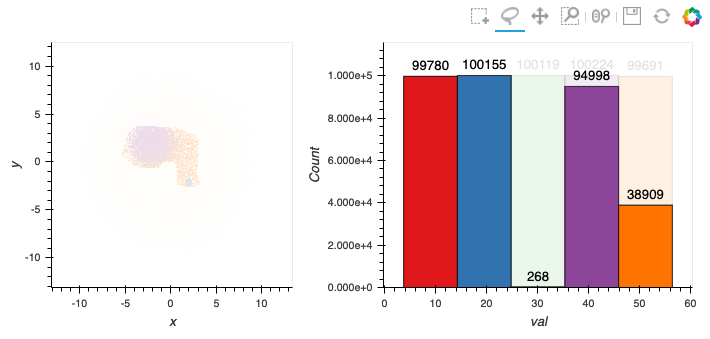
In the example I have modified this line so I only get one bin per color:

histogram = points.hist(num_bins=4, adjoin=False, normed=False).opts(color=dim_expr)

And the output with a selection looks like this:
image

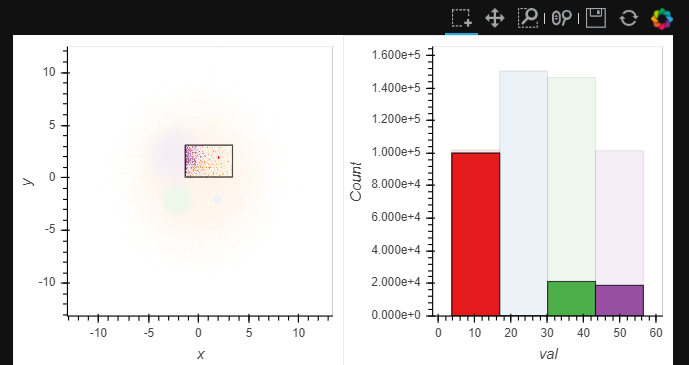
So I would like to understand how to have text labels above the bars that show the counts by color in the selection.

The goal is to show with the histogram the counts, but also to have a label that has an exact count in a text representation or label.

Here are two things I have tried:

import datashader as ds
import holoviews.operation.datashader as hd
from bokeh.models import NumeralTickFormatter

from bokeh.models import HoverTool

import numpy as np
import pandas as pd
import holoviews as hv

from holoviews.util.transform import dim
from holoviews.selection import link_selections
from holoviews.operation import gridmatrix
from holoviews.operation.element import histogram
from holoviews import opts

hv.extension('bokeh', width=100)


num = 100000
np.random.seed(1)

dists = {
    cat: pd.DataFrame({
        'x': np.random.normal(x, s, num), 
        'y': np.random.normal(y, s, num), 
        'val': np.random.normal(val, 1.5, num), 
        'cat': cat
    }) for x,  y,  s,  val, cat in 
     [(  2,  2, 0.03, 10, "d1"), 
      (  2, -2, 0.10, 20, "d2"), 
      ( -2, -2, 0.50, 30, "d3"), 
      ( -2,  2, 1.00, 40, "d4"), 
      (  0,  0, 3.00, 50, "d5")]
}

# tooltips = [
#     ('x', '@x')
# ]

points = hv.Points(pd.concat(dists), ['x', 'y'], ['val', 'cat'])
datashaded = hd.datashade(points, aggregator=ds.count_cat('cat'))
spreaded = hd.dynspread(datashaded, threshold=0.50, how='over')

# Declare dim expression to color by cluster
dim_expr = ((0.1+hv.dim('val')/4).round()).categorize(hv.Cycle('Set1').values)
histogram = points.hist(num_bins=4, adjoin=False, normed=False).opts(color=dim_expr, yformatter=NumeralTickFormatter(format='0,0'), tools=['hover'])

link_selections(spreaded + histogram*hv.Text(histogram.array()[0][0], histogram.array()[0][1], text=str(histogram.array()[0][1])))

It looks like this:
image

The first thing I tried was putting

tools=['hover']

in

histogram = points.hist(num_bins=4, adjoin=False, normed=False).opts(color=dim_expr, yformatter=NumeralTickFormatter(format='0,0'), tools=['hover'])

But the hover did not do produce any results.

The second thing I tried is to put Text on the histogram from the histogram.array data.
You can see I added this:

hv.Text(histogram.array()[0][0], histogram.array()[0][1], text=str(histogram.array()[0][1]))

into here:

link_selections(spreaded + histogram*hv.Text(histogram.array()[0][0], histogram.array()[0][1], text=str(histogram.array()[0][1]))

The issue with the second attempt is that it shows text from the original state - but I am not seeing a way to capture the data from the selected state - to add in the new frequency values.

Here’s my best current approach, maybe I can think of something better:

def get_labels(hist):
    xs, ys = hist.dimension_values(0), hist.dimension_values(1)
    return hv.Labels((xs, ys+0.05*ys.max(), ys),
                    kdims=hist.dimensions(), dataset=hist.dataset)
labels = histogram.apply(get_labels)

link_selections(spreaded + histogram * labels.opts(text_font_size='10pt', width=400))

To briefly explain what’s happening here, the .apply allows you to provide a function which will dynamically transform the Histogram to a set of Labels. We offset those labels by 0.05 the max value of the histogram to ensure they are on top of the bar.