import numpy as np
import holoviews as hv
hv.extension('bokeh')
ls = np.linspace(0, 10, 200)
xx, yy = np.meshgrid(ls, ls)
bounds=(-1,-1,1,1)   # Coordinate system: (left, bottom, right, top)
img = {1:hv.Image(np.sin(xx)*np.cos(yy), bounds=bounds).opts(colorbar=True,frame_width=200, frame_height=200,clabel='[eV]'),
      2:hv.Image(np.sin(yy)*np.cos(xx), bounds=bounds).opts(colorbar=True,frame_width=200, frame_height=200,clabel='[nm]')}
img = hv.HoloMap(img , kdims=['Type'])
img
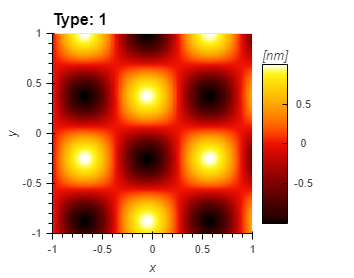
HoloMap only gives the clabel of the last image plot in the dict.