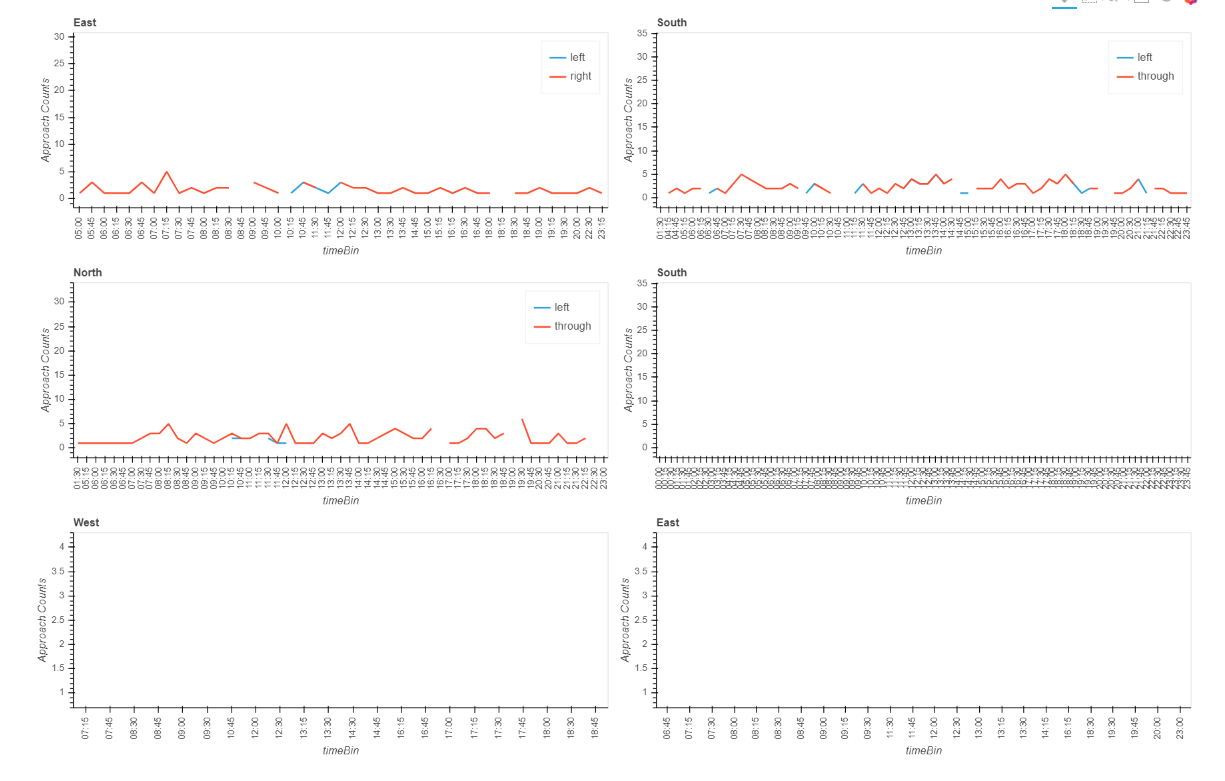
I need to Show 4 different Line Charts for each direction and for each day of the week.
Here is the idea:

I’m using * operator to merge curves in a single plot and + operator to create plots side by side.
But Now when I wrap those plots into holomap for each day. it throws an exception.
WARNING:param.Warning: Nesting Layouts within a HoloMap makes it difficult to access your data
or control how it appears; we recommend calling .collate() on the HoloMap in order to follow the recommended nesting structure shown in the Composing Data user guide (https://goo.gl/2YS8LJ)
ERROR:root:'HoloMap' object has no attribute 'set_path'
concurrent.futures.process._RemoteTraceback:
"""
Traceback (most recent call last):
  File "C:\ProgramData\Anaconda3\lib\concurrent\futures\process.py", line 239, in _process_worker
    r = call_item.fn(*call_item.args, **call_item.kwargs)
  File "testing2.py", line 217, in create_approach_plot
    hv.save(plot, outputFolder + 'testing_{0}.html'.format(variable_col))
  File "C:\ProgramData\Anaconda3\lib\site-packages\holoviews\util\__init__.py", line 799, in save
    return renderer_obj.save(obj, filename, fmt=fmt, resources=resources)
  File "C:\ProgramData\Anaconda3\lib\site-packages\holoviews\plotting\renderer.py", line 557, in save
    plot.layout.save(basename, embed=True, resources=resources)
  File "C:\ProgramData\Anaconda3\lib\site-packages\panel\viewable.py", line 684, in save
    embed_json, json_prefix, save_path, load_path)
  File "C:\ProgramData\Anaconda3\lib\site-packages\panel\io\save.py", line 130, in save
    model = panel.get_root(doc, comm)
  File "C:\ProgramData\Anaconda3\lib\site-packages\panel\viewable.py", line 642, in get_root
    root = self._get_model(doc, comm=comm)
  File "C:\ProgramData\Anaconda3\lib\site-packages\panel\layout.py", line 120, in _get_model
    objects = self._get_objects(model, [], doc, root, comm)
  File "C:\ProgramData\Anaconda3\lib\site-packages\panel\layout.py", line 110, in _get_objects
    child = pane._get_model(doc, root, model, comm)
  File "C:\ProgramData\Anaconda3\lib\site-packages\panel\pane\holoviews.py", line 227, in _get_model
    plot = self._render(doc, comm, root)
  File "C:\ProgramData\Anaconda3\lib\site-packages\panel\pane\holoviews.py", line 286, in _render
    return renderer.get_plot(self.object, **kwargs)
  File "C:\ProgramData\Anaconda3\lib\site-packages\holoviews\plotting\bokeh\renderer.py", line 73, in get_plot
    plot = super(BokehRenderer, self_or_cls).get_plot(obj, doc, renderer, **kwargs)
  File "C:\ProgramData\Anaconda3\lib\site-packages\holoviews\plotting\renderer.py", line 220, in get_plot
    obj = collate(obj)
  File "C:\ProgramData\Anaconda3\lib\site-packages\holoviews\plotting\util.py", line 75, in collate
    return obj.collate()
  File "C:\ProgramData\Anaconda3\lib\site-packages\holoviews\core\spaces.py", line 349, in collate
    drop_constant=drop_constant)()
  File "C:\ProgramData\Anaconda3\lib\site-packages\holoviews\core\element.py", line 481, in __call__
    accumulator.update(component)
  File "C:\ProgramData\Anaconda3\lib\site-packages\holoviews\core\tree.py", line 103, in update
    self[identifier] = element
  File "C:\ProgramData\Anaconda3\lib\site-packages\holoviews\core\tree.py", line 175, in __setitem__
    self.set_path(identifier, val)
  File "C:\ProgramData\Anaconda3\lib\site-packages\holoviews\core\tree.py", line 122, in set_path
    attrtree.set_path(path[1:], val)
  File "C:\ProgramData\Anaconda3\lib\site-packages\holoviews\core\tree.py", line 122, in set_path
    attrtree.set_path(path[1:], val)
AttributeError: 'HoloMap' object has no attribute 'set_path'
"""

The above exception was the direct cause of the following exception:

Traceback (most recent call last):
  File "testing2.py", line 288, in <module>
    data = future.result()
  File "C:\ProgramData\Anaconda3\lib\concurrent\futures\_base.py", line 428, in result
    return self.__get_result()
  File "C:\ProgramData\Anaconda3\lib\concurrent\futures\_base.py", line 384, in __get_result
    raise self._exception
AttributeError: 'HoloMap' object has no attribute 'set_path'