I’m trying to solve this SO-question:
https://stackoverflow.com/questions/59338762/is-there-a-way-to-filter-dimension-in-holoviews-shankey-diagram
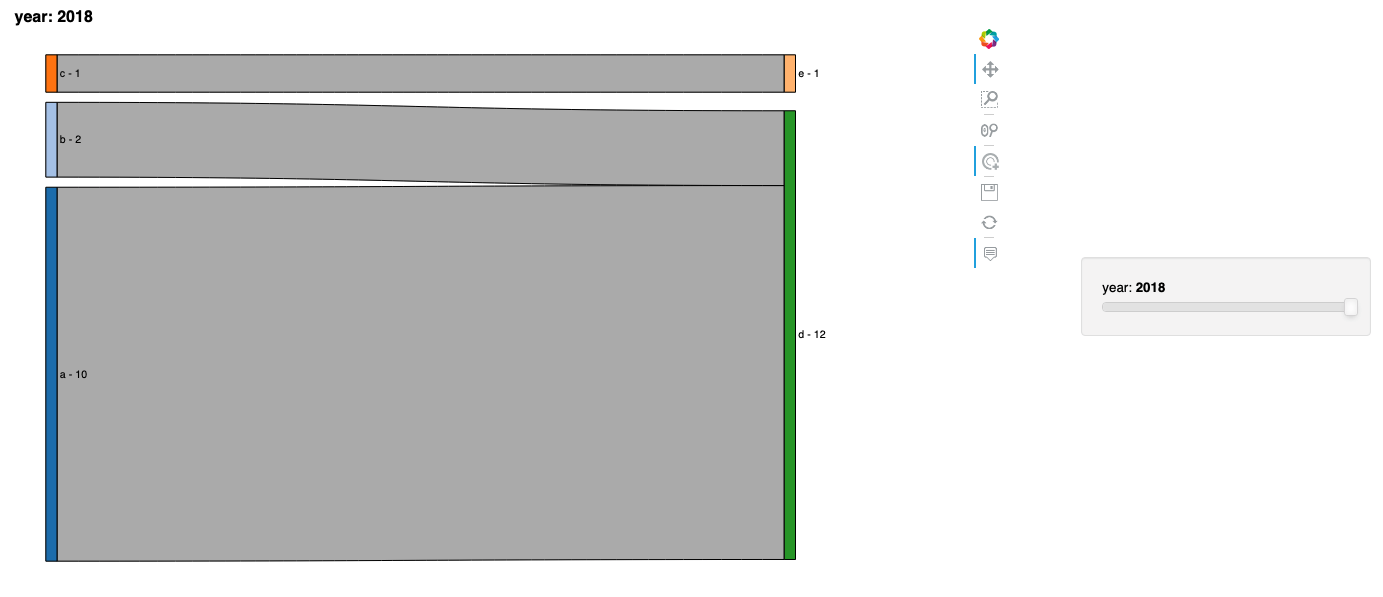
So basically a sankey plot with selection dropdown is needed where you can select year 2017 or 2018.
So I tried the following code below, and I thought this would give the dropdown on year, but it didn’t. It only gave me the 2017 plot. Is the expected behavior or a (known) bug? Is there a workaround possible?
import pandas as pd
import numpy as np
import holoviews as hv
hv.extension('bokeh')

df = pd.DataFrame({
    'from': ["a", "b", "c", "a", "b", "c"],
    'to': ["d", "d", "e", "e", "e", "d"],
    'number': [10, 2, 1, 8, 2, 2],
    'year': [2018, 2018, 2018, 2017, 2017, 2017],
})

sankey_dict = {
    year: hv.Sankey(df[df.year == year].loc[:, ['from', 'to', 'number']])
    for year in df.year.unique()
}

holo = hv.HoloMap(sankey_dict, kdims='year')